Methodological Issues and the Effect of White Pigments on Fading
Introduction
Lightfastness is usually reported in a single word or number—a simple answer for artists questioning a color’s permanence. Although lightfastness ratings are straightforward, lightfastness assessment is actually fairly complex, and a variety of factors can influence both laboratory and real-world lightfastness outcomes. To tackle the challenging issue of lightfastness, many artist paint manufacturers, including Golden Artist Colors, use ASTM International’s standards as a framework for lightfastness ratings and testing. The ASTM lightfastness standards comprise ratings for individual pigments in oil, watercolor, and acrylic media, as well as methods for determining the lightfastness of unrated pigments in these media.
Footnote: ASTM International is a standards organization composed of industry, independent-expert, and consumer volunteers, all concerned with the quality of the products and processes in their area of expertise. D01.57, the ASTM Artist Paints and Related Materials Subcommittee, is responsible for a variety of standards relating to artist paints, including lightfastness standards.
Much effort has gone into understanding lightfastness, but even the most tried materials can be brought into question by new research. As a result of recent findings, the ASTM Artist Paints and Related Materials subcommittee, on which GOLDEN serves, is researching the oil paint lightfastness standard, D4302. The subcommittee’s primary concern is variability in lightfastness resulting from the use of different mixing whites, as experiments performed by our lab and others have shown that some colors are less lightfast when mixed with certain white paints. In independent work, the GOLDEN Research & Development Lab found that Pyrrole Orange (PO73) is one of these colors (Image 1).
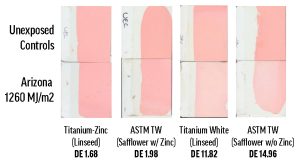
Image 1. Previous results with Williamsburg Pyrrole Orange. Sarah Sands presented these results at the 2018 ISCC Annual Meeting in Boston. Pyrrole Orange was mixed with different white paints and tested for lightfastness in Arizona using the D4302 protocol.
To better understand this issue as it applies to our products, GOLDEN carried out a study of Williamsburg Artist Oil Colors, screening for adverse interactions between colors and white paints. In addition to the color/white screening, we investigated several methodological parameters of D4302, including light exposure methods and aspects of sample preparation. We had two reasons for this additional research direction: most importantly, we wanted to gather more comprehensive information about the color/white issue; and secondly, we were seeking ways to simplify lightfastness testing without sacrificing accuracy—which is important for larger-scale studies, such as the work presented here. In the end, we produced approximately 5,000 samples, which received a cumulative 5,500,000 hours of exposure time, and generated 8,000 color measurements.
We found that several colors did fade substantially in certain contexts, but most of the pigments we tested performed at their established lightfastness rating with at least one white. Oil painters shouldn’t have many lightfastness surprises when using titanium or titanium-zinc whites for making tints, especially when the binder oil is linseed. Other whites, like lead or zinc whites and whites made with safflower oil, reduced the lightfastness of certain colors, and caution may be necessary when working with these materials. For more specific information about the lightfastness of color/white combinations, refer to Table 3, Table 6 and the Results: Lightfastness section.
Technical readers will be interested in our findings regarding lightfastness testing methodology. Our results suggest that the 40% reflectance criterion, which swells the burden of sample preparation, could be replaced with a simpler, ladder-style approach. Similarly, the absence of a substrate primer did not significantly affect sample integrity or lightfastness. We also came to some interesting results via experiments with light exposure protocols, which may be useful in the process of revising D4302.
Our primary motivation for studying ASTM standard D4302 is to improve our understanding of oil paint lightfastness, powering our mission to offer the best products and technical services (GOLDEN, WB) available. However, it is also essential that any manufacturer make the best use of its resources by streamlining research or development projects whenever possible. Thus, our secondary motivation in studying D4302 was to ensure the accuracy and comprehensiveness of our lightfastness testing while simplifying, as much as possible, our testing protocols. By finding easier ways to do lightfastness testing, we hope to enable artist materials manufacturers to test more of their products more often, increasing transparency for consumers.
Lightfastness is a property belonging to pigments, but fading is situational. Factors like binding medium, application method, and raw material variations all affect the chemical and physical properties of a paint film, changing the way pigments stand up to lighting—which is itself another variable. It is unfortunate that we need to lengthen the list of concerns by adding white paints, but it is our hope that a better understanding of this phenomenon will help artists, art conservators, manufacturers, and others to mitigate or prevent the worst lightfastness results. Inversely, deeper engagement from the industry, especially from manufacturers, would be beneficial to our collective knowledge of lightfastness. Ask the manufacturers of your art materials whether they perform ASTM lightfastness testing with their products, and about their ASTM involvement.
Method
Footnote: For a background on lightfastness testing, which is not given in complete detail here, please check out LF testing at GAC and Delta E: A Key to Understanding Lightfastness Readings.
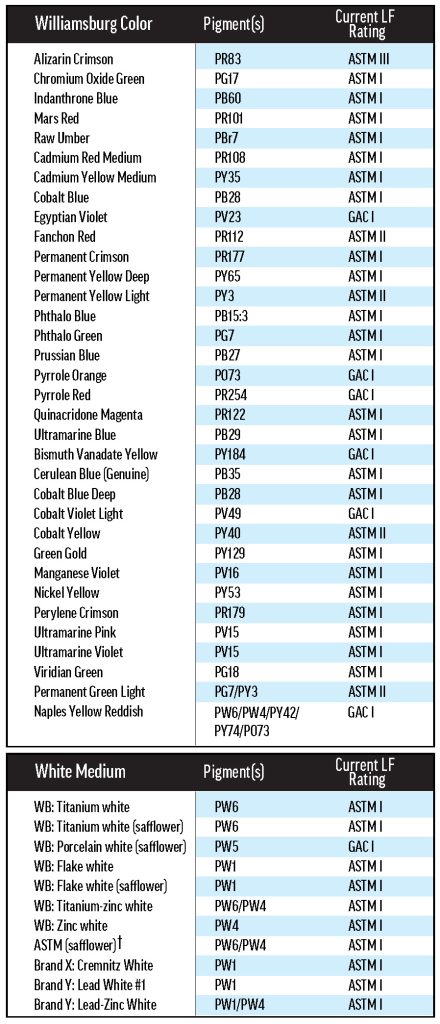
† “ASTM (Safflower)” refers to the tinting medium described in the ASTM standard for oil paint lightfastness testing. This white oil paint was made by the GOLDEN lab according to ASTM protocol.
Our primary objective was to screen Williamsburg colors for compatibility with Williamsburg whites, but another, major portion of this project was an independent study of ASTM lightfastness testing methodology. We investigated the correlation of different exposure methods, the influence of color saturation (or pigment concentration) on lightfastness, the necessity of priming aluminum panel substrates, and the relationship between color change and exposure time or intensity.
Our materials included an array of thirty-four Williamsburg colors and eleven white oil paints from both inside and outside the Williamsburg line. A list of materials is presented in Table 1. Our preparations of these materials fall into three categories: 40%-tints for each color/white combination, a three-rung ladder of concentrations for each color mixed with Williamsburg Titanium White, and the masstones (colors without any added white and whites without any added color) of each material.
First, we determined the appropriate color-to-white ratios for the 40%-tints required for ASTM lightfastness testing. For these mixes, ASTM D4302 stipulates that the sample’s reflectance spectrum, in the range of 420 to 620nm, contains a minimum within 40±5% reflectance. Next, we scaled-up the 40% recipes and applied 0.15mm (6mil) films of these tints to unprimed aluminum panels and industry-standard lacquered drawdown cards. Tints made with the ASTM white medium were also applied to aluminum panels primed (via HVLP spray gun) with a basecoat made to the specifications of D4302, so that the effect of the primer could be determined. All samples were allowed to cure for six months in intermittent office lighting. After curing, we began exposure testing, which took between three weeks and three months depending on the exposure method.
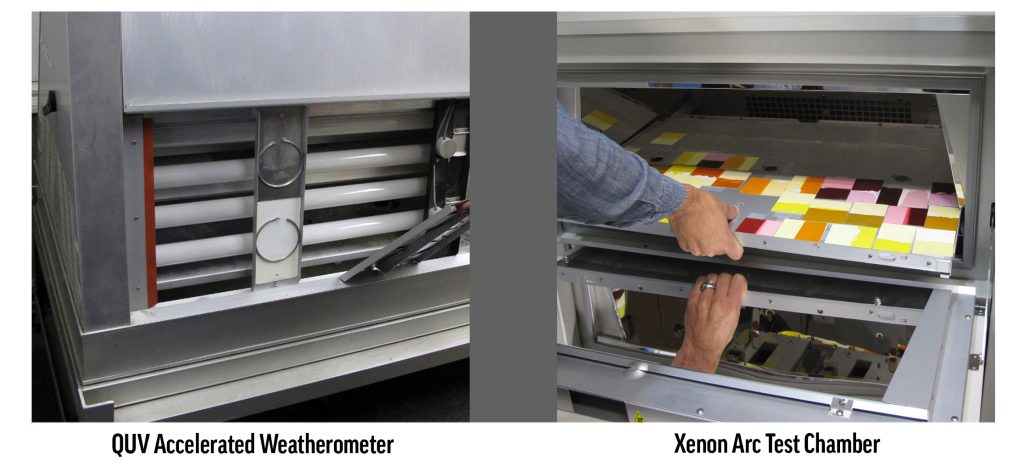
Our exposure methods followed ASTM specifications, and included outdoor testing in Arizona and Florida (1260MJ/m2 cumulative intensity) performed by Atlas Material Testing Technology, LLC, as well as indoor testing using a xenon arc chamber (510kJ/m2). These methods both employ a protective glass window for filtering light before it reaches the samples, simulating the exposure conditions of paintings hung indoors. We also used a fluorescent lamp QUV chamber, where the light is unfiltered. We typically use this method for coatings that will be used outside, since it is higher energy and better represents long-term outdoor exposure. All outdoor and xenon arc tests were performed in triplicate: three aluminum panels were sent to Arizona or Florida, and three test strips were cut from each drawdown card for xenon testing. The outdoor samples were staggered so that three sets of samples were sent out over late fall to early spring, while the xenon samples were tested in a series of subsequent runs. We did not send every mix to Florida, since the entrained dirt and humidity-induced softening of the returned samples complicated the interpretation of color change.
We experimented with two exposure methods using the QUV: constant light exposure for 1,600 hours, measuring color change every 400 hours; and periodic light exposure for a net total of 1,600 hours, programming the lamps to turn off for 8 hours each night for 100 days. Periodic exposure has been reported to induce catalytic activity in titanium dioxide, and we wanted to test for this effect in our materials3. The continuous QUV tests were run in duplicate, while the discontinuous tests were run singly and selectively, as this testing restricted instrument time available for other projects.
Following exposure, we collected reflectance spectra and calculated the color distance (ΔE* in CIEL*a*b* 76) between the exposed samples and the unexposed controls (UECs). Our instruments for measuring reflectance included a non-contact spectrophotometer and a benchtop spectrophotometer from X-Rite. We used the non-contact instrument for measuring pre-mixes, and the traditional spectrophotometer for all other readings.
Footnote: Obtaining a suitable reflectance spectrophotometer is one of the greatest barriers to performing lightfastness testing and other advanced colorimetry tasks, so we would like to mention that there are currently affordable, portable instruments available that seem to have good accuracy: we have been experimenting with the Spectro 1™ from Variable™.
There was a UEC for each combination of color, white, substrate, ground (if any), and colorant concentration, which were stored in the R&D Lab at Golden Artist Colors under intermittent office lighting to prevent dark yellowing. Color measurements of each UEC were made just before the first corresponding sample returned from exposure testing. The UEC measurements were not repeated, and were used to calculate color change for all corresponding samples.
Results
Results: Lightfastness
This section deals primarily with the lightfastness of individual oil paints, while the Results: Method section contains our findings about test method. Note that, unless otherwise specified, only Arizona and xenon exposure results were used to calculate average color change. For a more detailed comparison of all the exposure types, including QUV and Florida, see Results: Method.
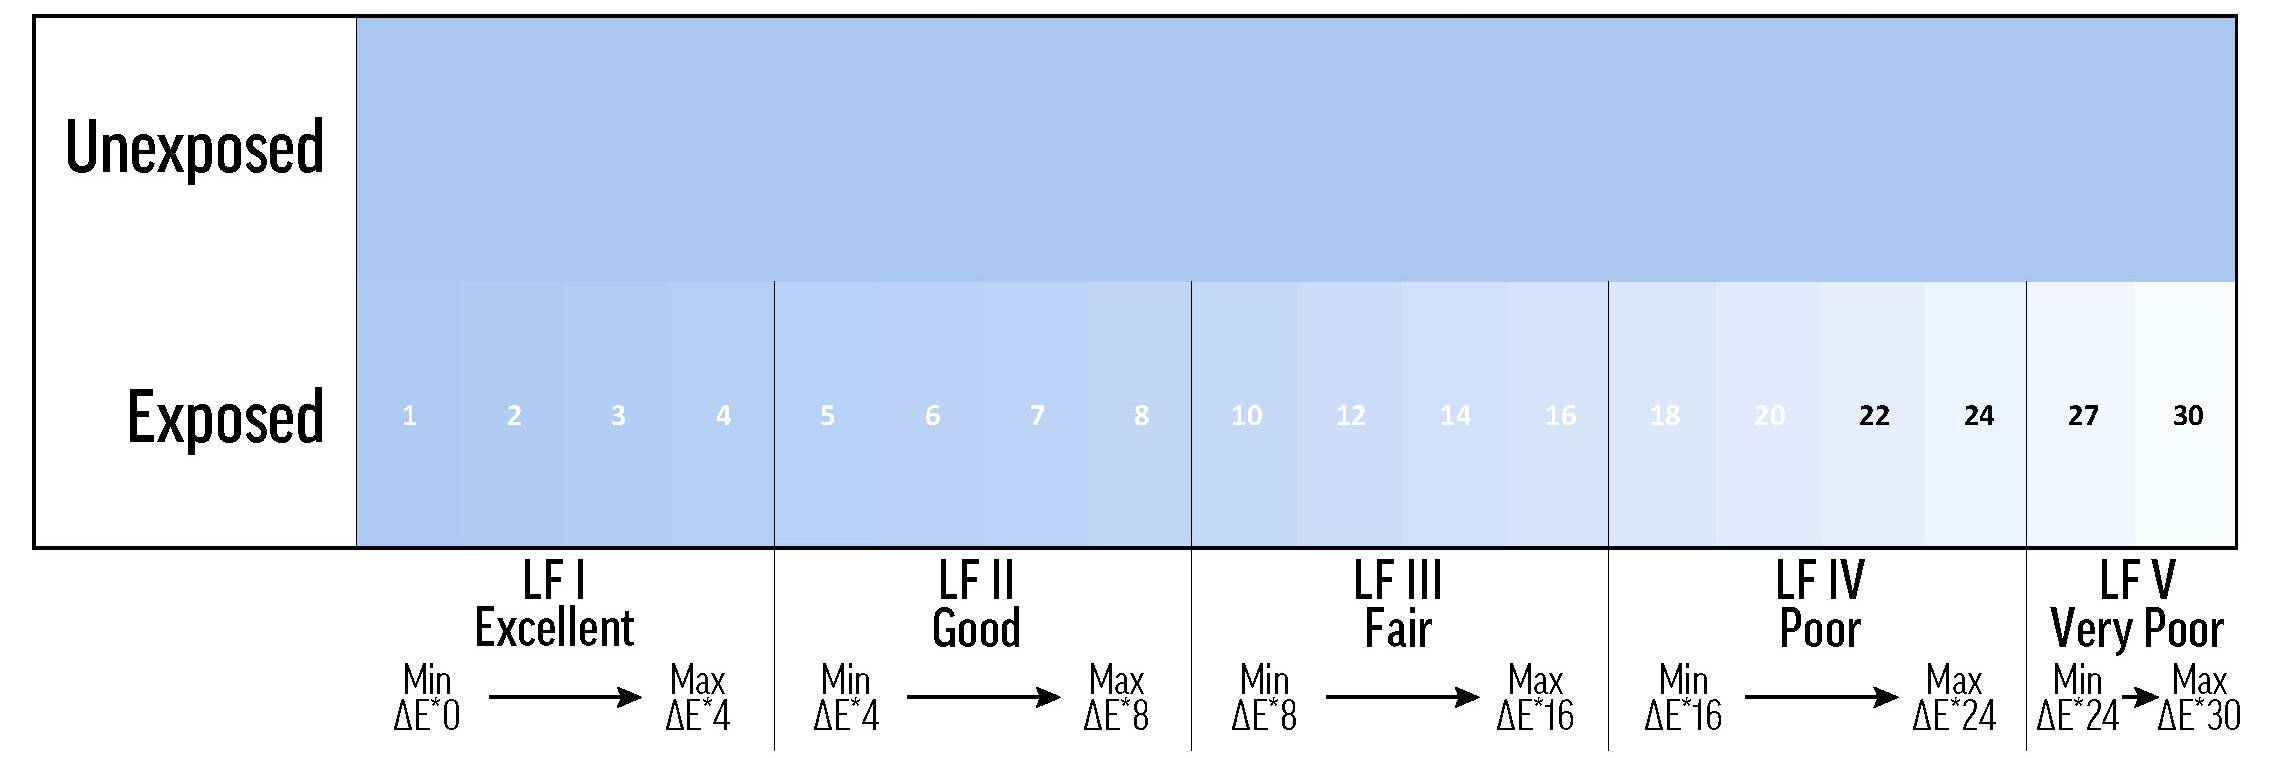
For ease of comparison, we use the lightfastness categories of Table 2 to describe color change in a broad range of samples. It is technically inaccurate to, for instance, call a color’s masstone LF I, since in the strictest sense only pigments themselves can be designated with an LF categorization (with respect to a specific medium—oil paint in this case)—following testing with a tinting medium at 40% reflectance.
Tints
As described in Method, there were two categories of tints prepared and tested: the first was a ladder of increasingly saturated tints in Williamsburg Titanium White, and the second was an array of 40%-tints. Some of the findings from the tint ladder experiments have more bearing on method than on the lightfastness of the tested oil paints, but certain pertinent results are included in this section.
Williamsburg Titanium White Ladder
Each color was mixed with Williamsburg Titanium White in a ratio of 1.00g color to 10.00g white (9.1% color by weight). Two additional tint ratios were then chosen such that the most- and least-saturated of the three flanked the 40%-tint required for ASTM testing. As often as possible, a fixed set of concentrations were used to compose the remaining rungs in the tint ladder: concentrations of 0.1, 0.4, 4.8, and 28.6% were the most common, with stronger-tinting colors (like Phthalo Blue) more often appearing in dilute mixtures, and weaker-tinting colors (like Ultramarine Violet) in those more concentrated.
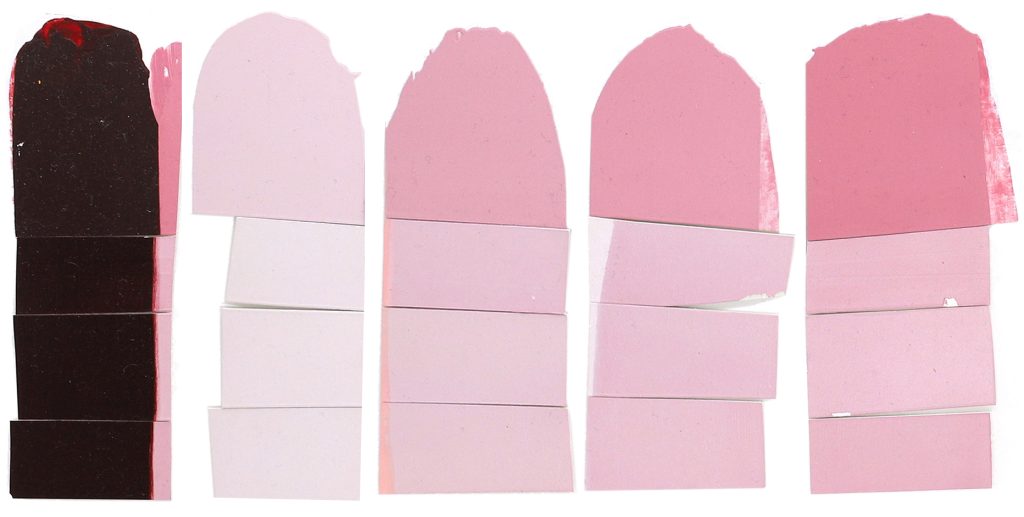
From left to right: Alizarin Crimson masstone (100% color by weight); Alizarin Crimson tints in Williamsburg Titanium White: 0.1%, 3.7%, 4.8%, and 9.1% (percent color by weight). The three rectangular pieces at the bottom of each color were tested in the xenon chamber, while the top section was the unexposed control (UEC) for each.
Alizarin Crimson (PR83) was the most dramatic example of a color with concentration-dependent lightfastness. As the concentration of Alizarin Crimson increased, its lightfastness decreased, so that its tints returned ΔE* values spanning LF II to LF IV categories (Figure 1). Combined with Alizarin Crimson’s LF I result in the masstone, this data complicates the official LF III rating from ASTM.
The Williamsburg colors’ concentration dependence was most notable for the few colors that were LF II or worse when mixed with Titanium White. Like Alizarin Crimson, Permanent Yellow Light (PY3) faded more as concentration increased, but the relationship was weaker: the higher-concentration tints performed worse (low-LF II) and the less saturated tints kept their color better (LF I). By contrast, Green Gold’s (PY129) tint ladder led down, rather than up: as concentration increased, lightfastness improved from LF II to LF I. The majority of colors, however, didn’t convincingly tend towards better or worse lightfastness as concentration was varied (see Viridian Green (PG18) in Figure 1). From our results, we would expect that color/white combinations with poorer or inconsistent lightfastness will exhibit functionally important concentration-dependent fading, while colors that are generally lightfast will probably not show a strong relationship between fading and concentration.
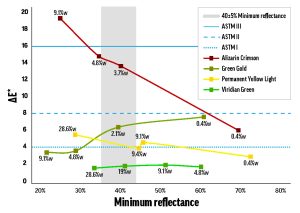
Figure 1. Concentration-dependent fading of mixes with Titanium White.
The data points are labeled with concentration of color (percent weight),
and the black horizontal lines indicate the maximum ΔE* for the first three lightfastness categories. The gray bar is the region tested by ASTM D4302.
Exposure type can also have an effect on concentration-dependent fading—see Results: Method – Color Concentration.
Combination Testing
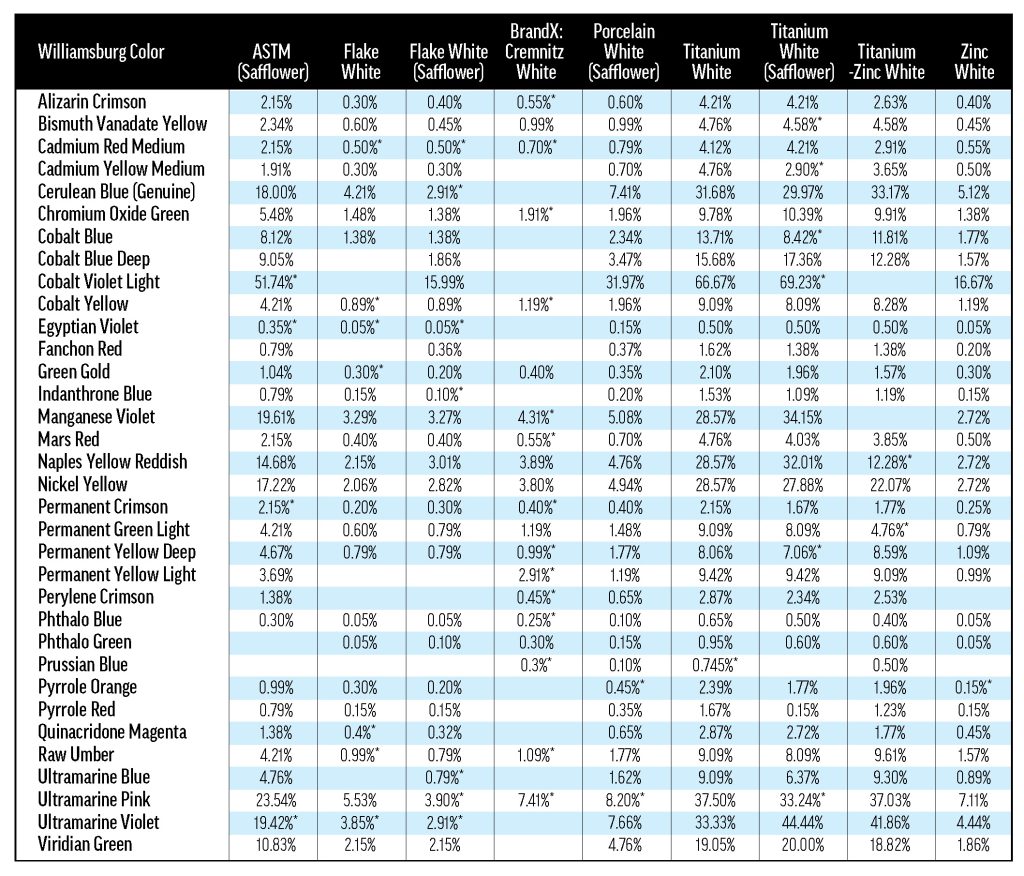
The tints reported in this section were made up to 40% minimum reflectance, as described in Method. However, some tints conforming to the ASTM standard’s minimum reflectance criterion no longer met this requirement after curing for six months. The most common reason for this color change was yellowing—though yellowing was not the only explanation (see Results: Reactivity of Lead Whites for an extreme case). About 15% of the UECs drifted out of range while curing (most are in the 30-50% minimum reflectance range—see Table A.1). We have included all of the tints, both in-spec and out, in this report.
The white paints used in this study can be grouped by two primary components: pigment and oil. A variety of standard white pigments were studied, including lead (PW1), titanium (PW6), zinc (PW4), and lithopone (PW5). Most of the white paints contained linseed oil, but some were safflower-based.

From left to right: Pyrrole Orange tinted with Flake White, ASTM mixing white, and Flake White Safflower. With the ASTM mixing white (center), Pyrrole Orange underwent barely any color change during exposure testing. When tinted with Flake White (left), Pyrrole Orange underwent significant yellowing, but did not fade to a high degree. Flake White Safflower (right) caused Pyrrole Orange to fade dramatically, and yellow noticeably.
Effect of Oil Type
Generally, the white paints lost some of their yellowness over exposure testing (see Table 5), a process referred to here as de-yellowing. De-yellowing may be interpreted as forced curing, or the reversal of natural yellowing. In any case, its influence on overall color change is an unavoidable artifact of oil paint lightfastness testing. Paints that yellow more as they cure are likely to exhibit greater color change during light exposure as that yellowing is undone, which has the effect of increasing the measured ΔE*—and reducing apparent lightfastness. One way to mitigate yellowing is to use safflower oil, as explained in Williamsburg’s New Safflower Colors.
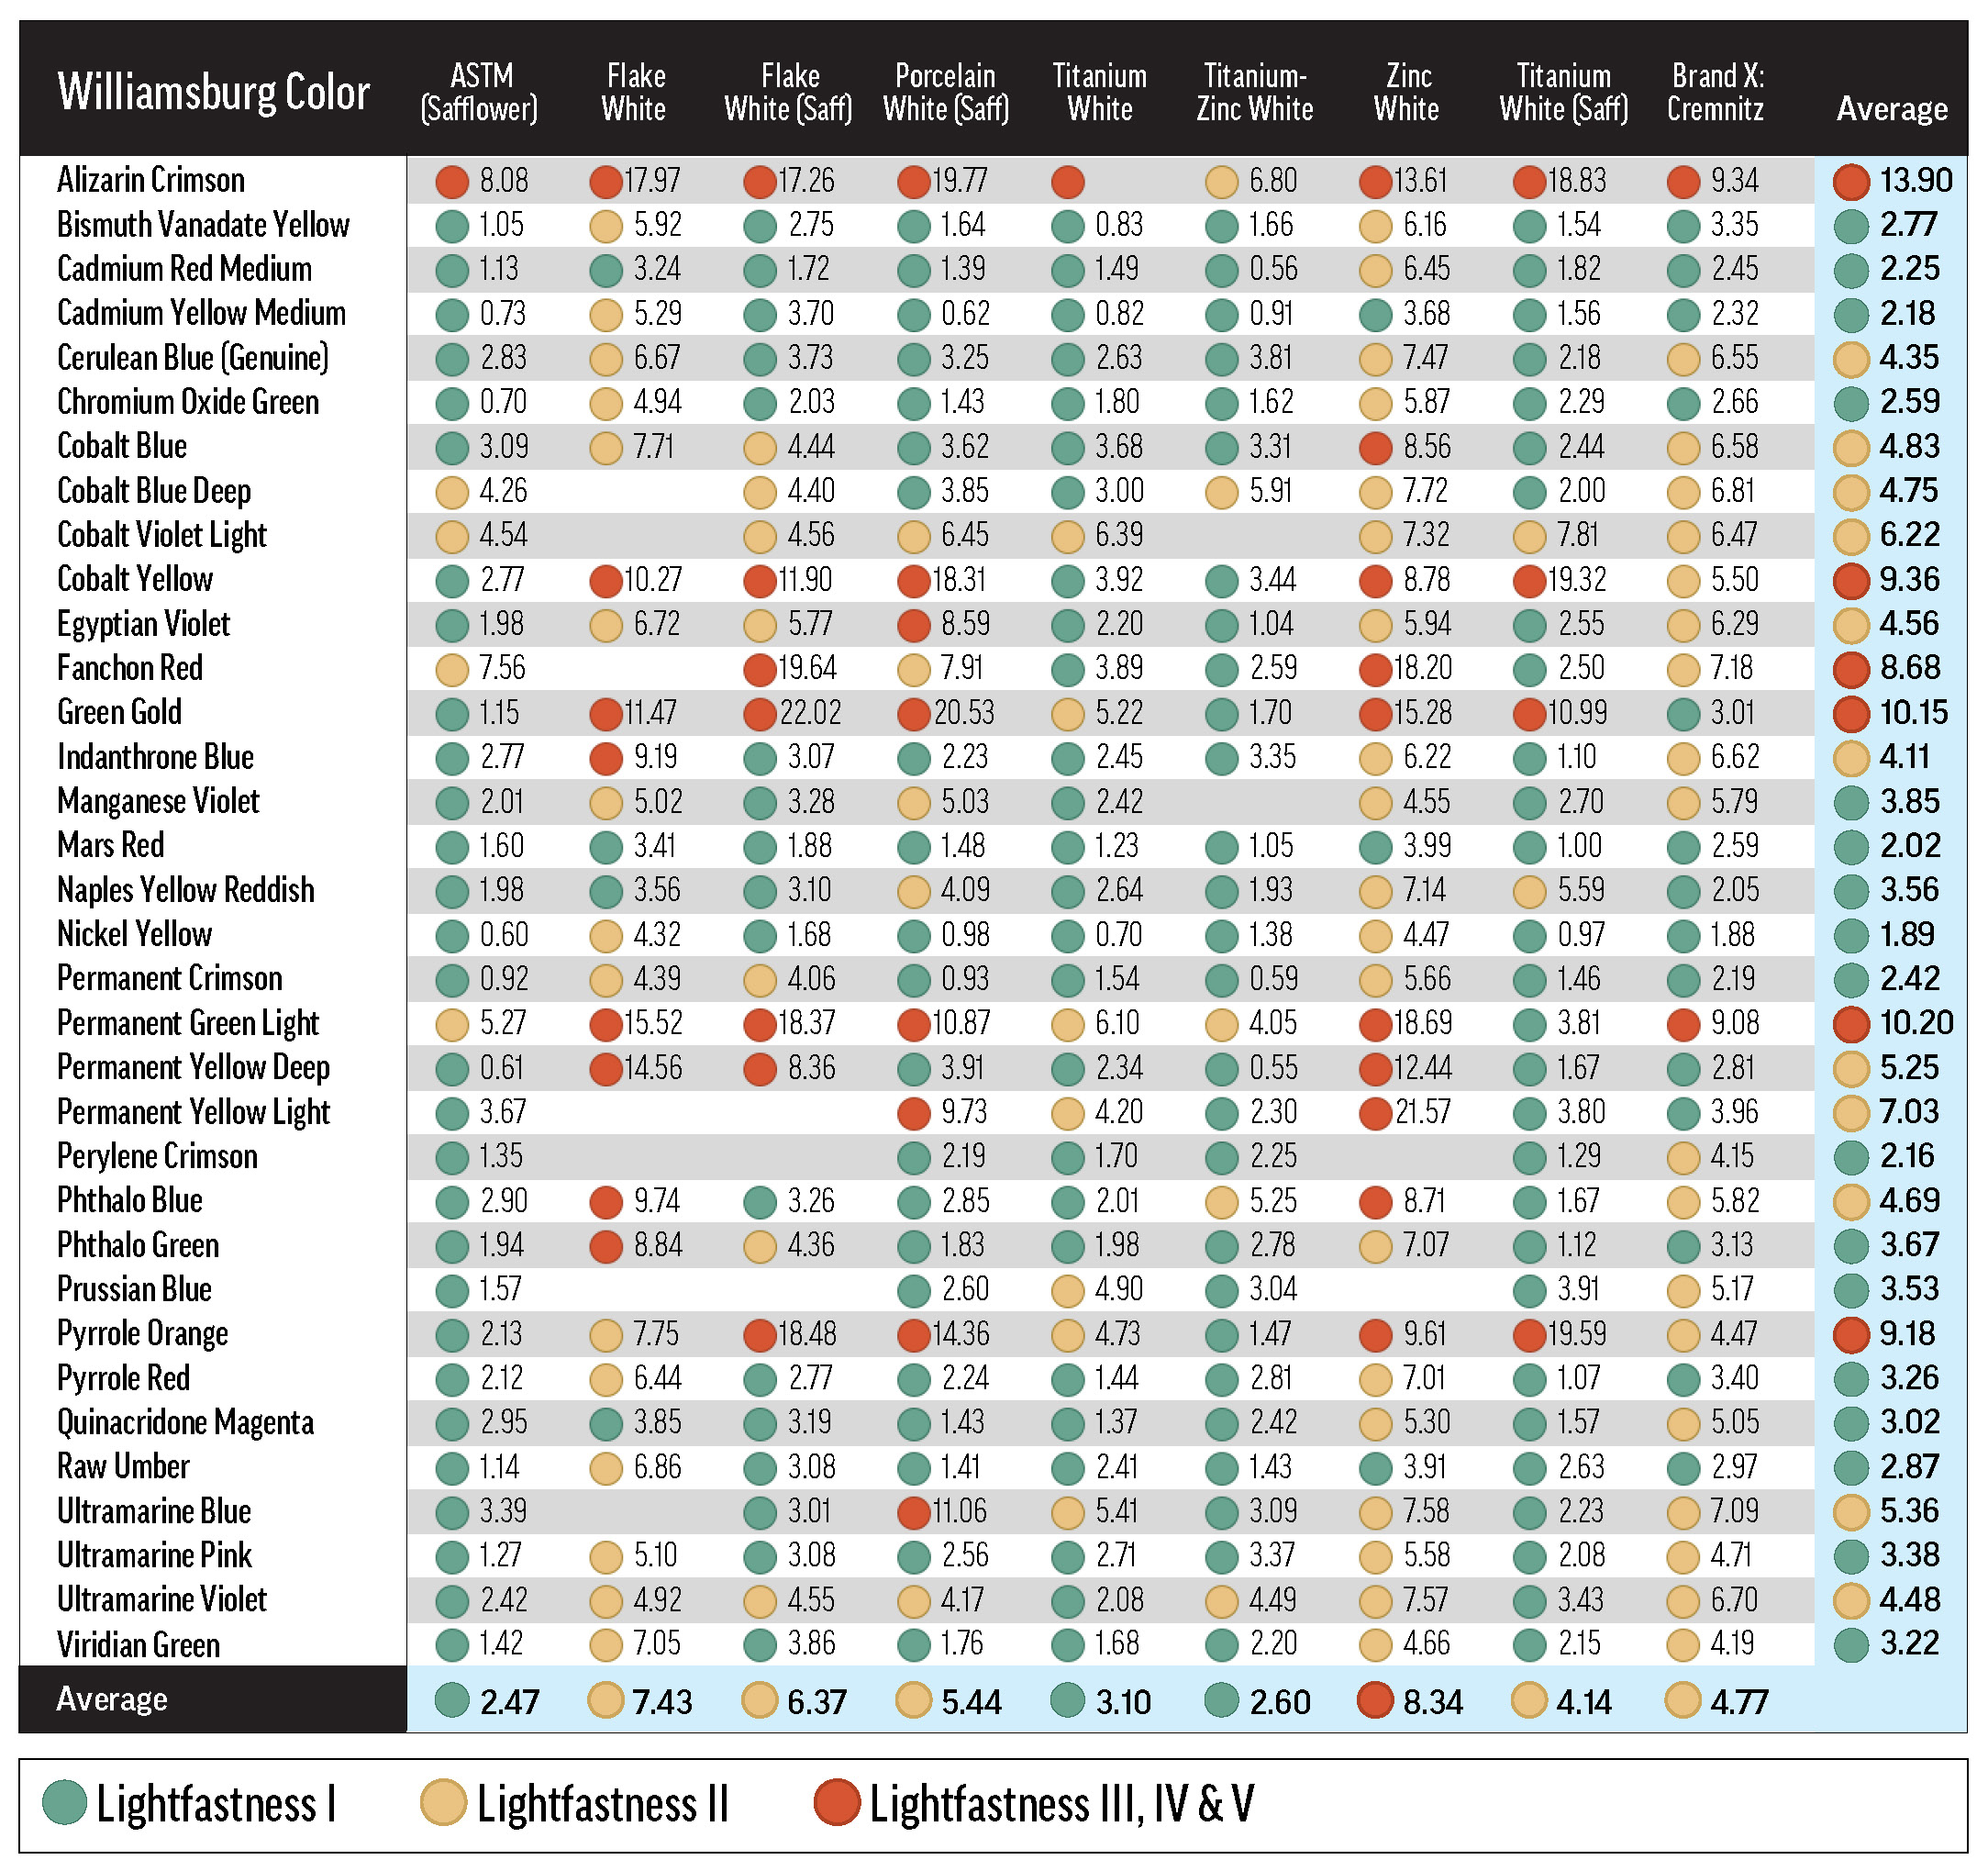
Green, yellow, and red dots indicate LF categories I, II, and III or greater. Most of the tints represented in this table conformed to the 40% minimum reflectance criterion, or were just a bit outside the allowable range (see Table A.1). Some combinations with Flake White absent from this table are discussed in Reactivity of Flake White.
By reducing yellowing (and consequently reducing de-yellowing in exposure testing), safflower oil improved the apparent lightfastness of many colors in this study. However, a few colors faded drastically in safflower oil, ranking far outside of their normal lightfastness category with the safflower-based lead or titanium whites. The colors that faded more in Titanium White Safflower than in linseed Titanium White also tended to fade more in Flake White Safflower than in linseed Flake White. An example of a color that faded substantially with safflower oil was Pyrrole Orange: the ΔE* with Titanium White Safflower was 4.9 units greater than with linseed Titanium White, and the Flake White Safflower ΔE* was 10.7 units greater than the linseed Flake White ΔE*.
Footnote: Numerically, whenever the Titanium White Safflower ΔE* was at least 4.0 units greater than the linseed Titanium White ΔE*, it was implied that the Flake White Safflower ΔE* was similar to (within 5% of) or greater than the linseed Flake White ΔE*. This was true for every Williamsburg color we tested.
Green Gold (PY129), Cobalt Yellow (PY40), and Pyrrole Orange (PO73) all faded with safflower-based Williamsburg whites, but were acceptably lightfast with ASTM safflower white. The ASTM white results make it clear that, even for these safflower-sensitive colors, choice of binding oil is not the sole determinant of lightfastness. In fact, the lightfastness results of the ASTM white tints were most similar to those of the Williamsburg Titanium-Zinc White tints: these two white formulations include the same primary white pigments (in different amounts), but are distinguished by oil type.
Effect of White Pigment
Porcelain White Safflower, Williamsburg’s lithopone (PW5) white, was not directly compared to a linseed counterpart; but by comparing the lightfastness of tints made with other safflower-based whites to those made with Porcelain White, we were able to glean some insights about lithopone. Every color that faded appreciably more in Titanium White Safflower than linseed Titanium White also faded in Porcelain White, suggesting that, unlike the ASTM safflower white, Porcelain White did not overcome the deleterious effect of safflower oil. In fact, there were a few instances when mixes with Porcelain White were less lightfast than corresponding mixes with other safflower whites. The existence of this group—composed of Permanent Green Light (PG7/PY3), Ultramarine Blue (PB29), Permanent Yellow Light (PY3), Egyptian Violet (PV23), and Fanchon Red (PR112)—suggests that lithopone (in safflower oil) may reduce the lightfastness of certain pigments. It’s also notable that Green Gold (PY129) faded about twice as much with Porcelain White as with Titanium White Safflower, though both tints exhibited relatively low lightfastness.
Zinc White produced some of the least lightfast tints. Not only did many samples fatally embrittle—often to the point of falling off of the substrate—in QUV and xenon testing, but the survivors tended to chalk or turn gray. Of the intact samples, most were at best LF II. A few colors were particularly prone to fading when mixed with Zinc White: tints with Fanchon Red (PR112), Green Gold (PY129), Permanent Green Light (PG7/PY3), and Permanent Yellow Light (PY3) were all ranked LF IV, and the ΔE* of the tint with Alizarin Crimson (PR83) was near the upper limit of the LF III range. Most of these colors had relatively poor lightfastness with one or more of the other whites, so we suspect that Zinc White may exacerbate lightfastness issues, rather than cause new ones.
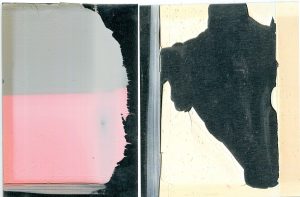
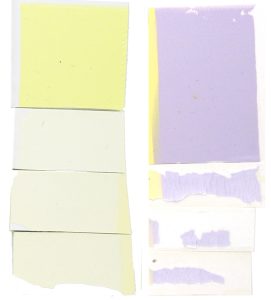
Left: The Zinc White tint of Permanent Yellow Light (PY3) faded significantly, though chalking was not detected in this case.
Right: The Zinc White tint of Egyptian Violet (PV23) cracked and fell off of the substrate during testing.
Though Zinc White performed poorly in lightfastness testing, Titanium-Zinc White was among the best tinting whites, and was comparable to linseed Titanium White. In some cases, Titanium-Zinc White was actually more color protective than Titanium White, but the differences were mostly small and inconsistent. Because of past results, we had somewhat expected to see a marked improvement in lightfastness with Titanium-Zinc White over Titanium White, but our experiments did not provide sufficient support for this hypothesis. It may, however, be noteworthy that Alizarin Crimson’s ΔE* was significantly lower with Titanium-Zinc White than with Titanium White.
Similarly, de-yellowing did not differentiate Titanium-Zinc White and Titanium White. As mentioned elsewhere on Just Paint (e.g., Update on Zinc), adding a small amount of zinc to Titanium White decreases yellowing, so the effect of de-yellowing on the apparent color change of exposed samples should be somewhat reduced in certain cases. This difference was, however, immaterial after color had been added to these two whites. The Δb* and the proportion of Δb* to overall color change were compared on a color-by-color basis for Titanium White and Titanium-Zinc White tints, and we did not find a significant difference.
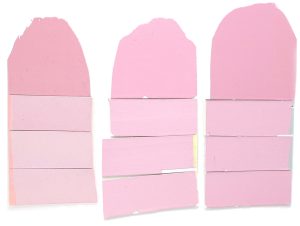
From left to right: Alizarin Crimson (PR83) tinted with Williamsburg Titanium White, Williamsburg Titanium-Zin White, and the ASTM safflower mixing white. The fading of Alizarin Crimson is noticeably reduced when zinc accompanies titanium in the mixing white.
There were few notable discrepancies between Titanium White and Titanium-Zinc White LF categorizations, with most colors finishing in the range of LF I or II. Some of the cobalt-containing colors and synthetic inorganics (enumerated in Results: Lightfastness – Masstones) appeared in the low end of the LF II range with one or both of these white mediums, but this is partly due to the sensitivity of these materials to xenon arc exposure. A few organic colors ranked LF II with Titanium White and LF I with Titanium-Zinc, and even fewer exhibited the inverse relationship, but these differences were small enough to elicit some skepticism about repeatability. It may be the case that the lightfastness of these colors is concentration-dependent (the concentration of Alizarin Crimson, for example, in Titanium-Zinc was about half its concentration in Titanium, since zinc oxide is more transparent than titanium oxide—see Table A.1), or that test variation is responsible. While these whites may have performed similarly for lightfastness, it is important for artists to keep in mind film brittleness when using zinc, since even titanium-zinc blends are notably more brittle than titanium white.
Phthalo Green (PG7) and Quinacridone Magenta (PR122) tints chalked significantly in QUV testing. On the left,the unexposed control (UEC) shows the initial color of the tints, and the exposed samples (right) demonstrate the chalking that was sometimes seen with Flake White or Flake White Safflower tints. This degree of color change was not observed when these colors were tinted with whites not containing lead.
The final two Williamsburg whites included in this survey were Flake White and Flake White Safflower. As mentioned above, Flake White Safflower tints were, on aggregate, more color-stable than tints with linseed Flake White. In the more extreme cases, like Phthalo Blue (PB15:3) and Indanthrone Blue (PB60), the Flake White tint is LF III while the Flake White Safflower tint is LF I or low-LF II. On the other hand, there were some colors that were especially fugitive with lead that did not display a preference for safflower or linseed oil, such as Fanchon Red (PR112), Permanent Green Light (PG7/PY3), and Permanent Yellow Deep (PY65). These results suggest that the lead white pigment, regardless of binder oil, can reduce the lightfastness of certain colors. Additionally, many Flake White and Flake White Safflower tints yellowed dramatically, and significant chalking was seen in some cases, especially in QUV testing.

Cobalt Blue (PB28) tints from left to right: Titanium-Zinc tint tested in Arizona, Titanium White tint tested in QUV, Flake White tint tested in Arizona. The Flake White tint yellowed dramatically in Arizona testing. Each of these tints began with a hue close to that of the Titanium-Zinc tint (left).
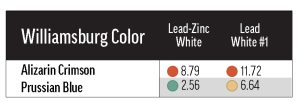
We also included three lead-based whites from other manufacturers: Brand X’s Cremnitz White (PW1), and Brand Y’s lead-zinc (PW1/PW4) and lead-only (PW1) whites. We were able to test each of the Williamsburg colors in Table 1 with the Cremnitz, and found that, probably because of this white’s high degree of yellowing (see Results: lightfastness – Masstones), most combinations resulted in a rating of LF II. Permanent Green Light (PG7/PY3) and Alizarin Crimson (PR83) ranked LF III with Cremnitz, but these colors’ tendency to fade was demonstrated broadly with the other white mediums. Interestingly, the colors that performed the worst with Flake White didn’t exhibit particularly bad lightfastness with Brand X’s Cremnitz. For example, Green Gold (PY129) faded excessively in Flake White but not in Cremnitz. Finally, when we tested Prussian Blue (PB27) and Alizarin Crimson with Brand Y’s lead-based whites, we found that the lead-zinc mixes were somewhat more color-stable than the lead-only mixes (Table 4).
The ASTM mixing white’s lightfastness was similar to that of Williamsburg Titanium-Zinc White. Only a few colors ranked LF II or worse with the ASTM white medium, and these were colors with moderate-to-poor lightfastness in other white paints.
Footnote: The ASTM white is not available to consumers. For reasons including tint strength, shelf stability, and certain working properties, we do not use this formula for any of our whites. The ASTM white has been considered useful in lightfastness testing because it provides historical continuity and is not biased towards any one art materials manufacturer, but it is in some ways impractical: it does not simulate many of the white paints on the oil paint market, and it adds an extra layer of difficulty to ASTM lightfastness testing, since it is required that the group doing the testing must manufacture (and have the resources to manufacture) this paint.
Masstones
Whites
The color change of the white masstones can be mostly explained by de-yellowing. The lead white masstones, however, tended not only to de-yellow, but also to gray. The graying and de-yellowing of the linseed-based lead whites increased the magnitude of their color shift, causing them to group, along with Zinc White, in the LF II-to-low-LF III range. This group was also more susceptible to color change in QUV exposure than the other whites (see Table 6). Interestingly, Brand X’s Cremnitz White did not gray much (possibly because of the source of lead white) and only ranked LF III because of its high degree of de-yellowing.
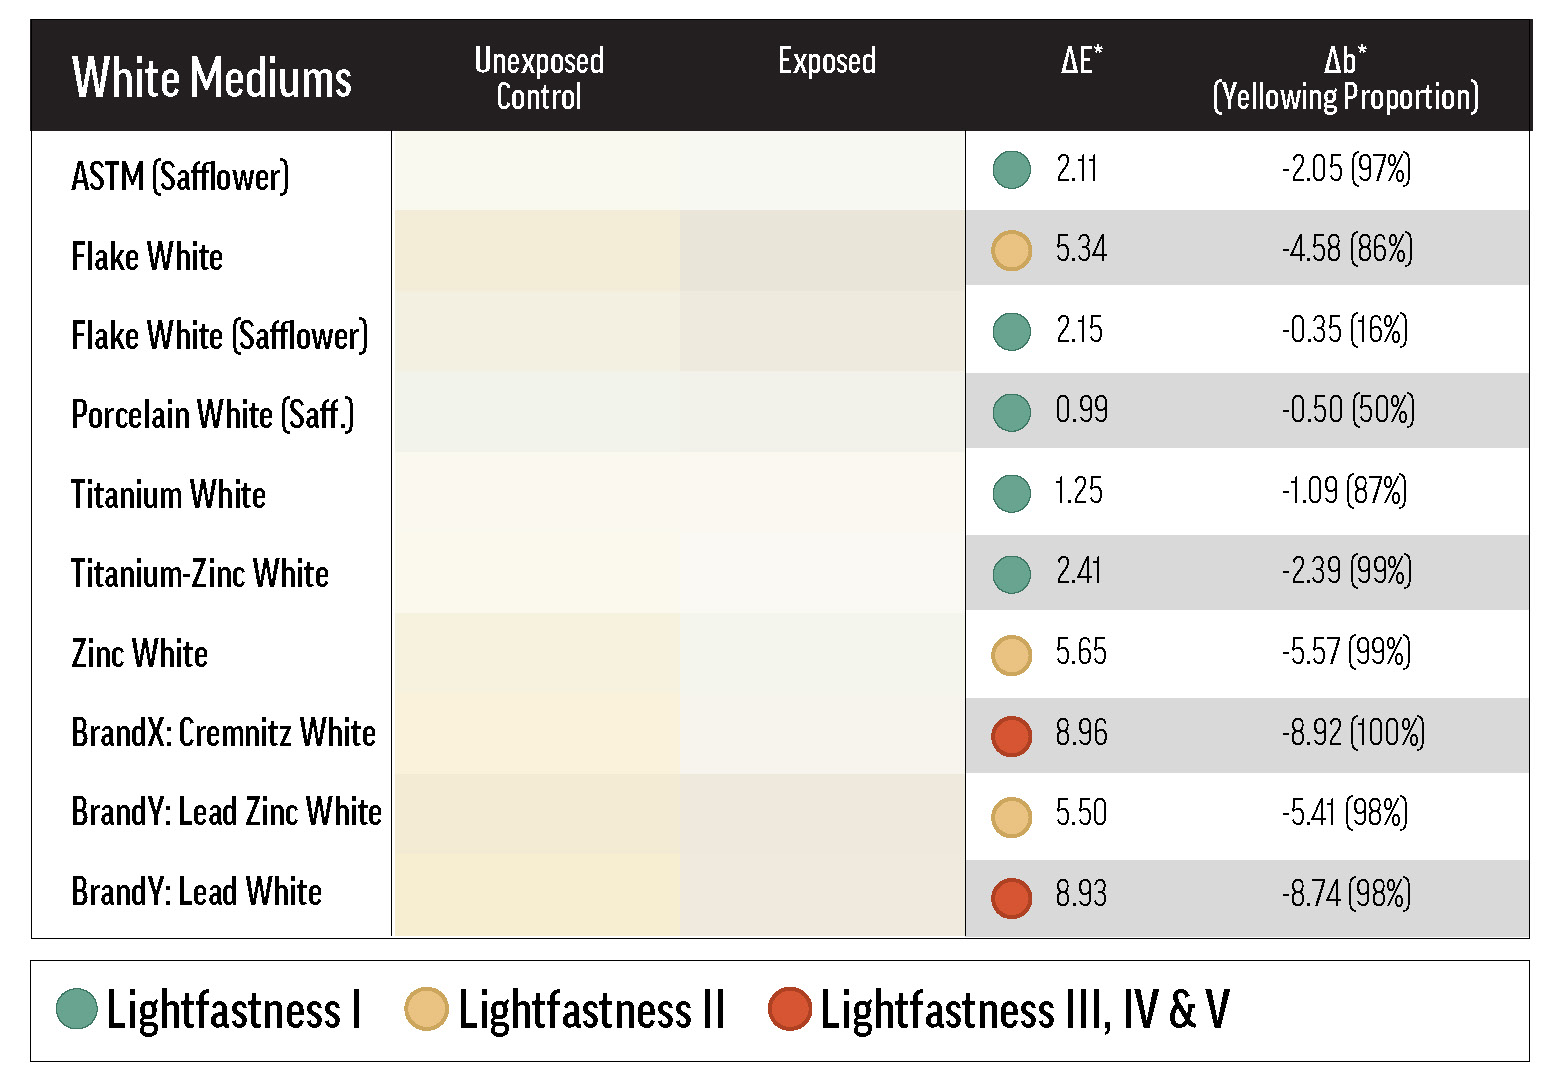
In the masstone, Flake White Safflower underwent significantly less color change (LF I in most tests) than the standard linseed product, and this may be related to the binders’ unequal propensities to yellow. Since some yellowing is reversed by UV exposure, paints that yellow more quickly, or to a greater extent, will appear to change color more dramatically over lightfastness testing. Safflower oil should yellow less than linseed when used in analogous contexts, and indeed the linseed Flake White UEC was yellower than the Flake White Safflower UEC after curing (between the two UECs, Δb* = 1.11). Only Porcelain White, another safflower paint, de-yellowed less than Flake White Safflower.
Colors
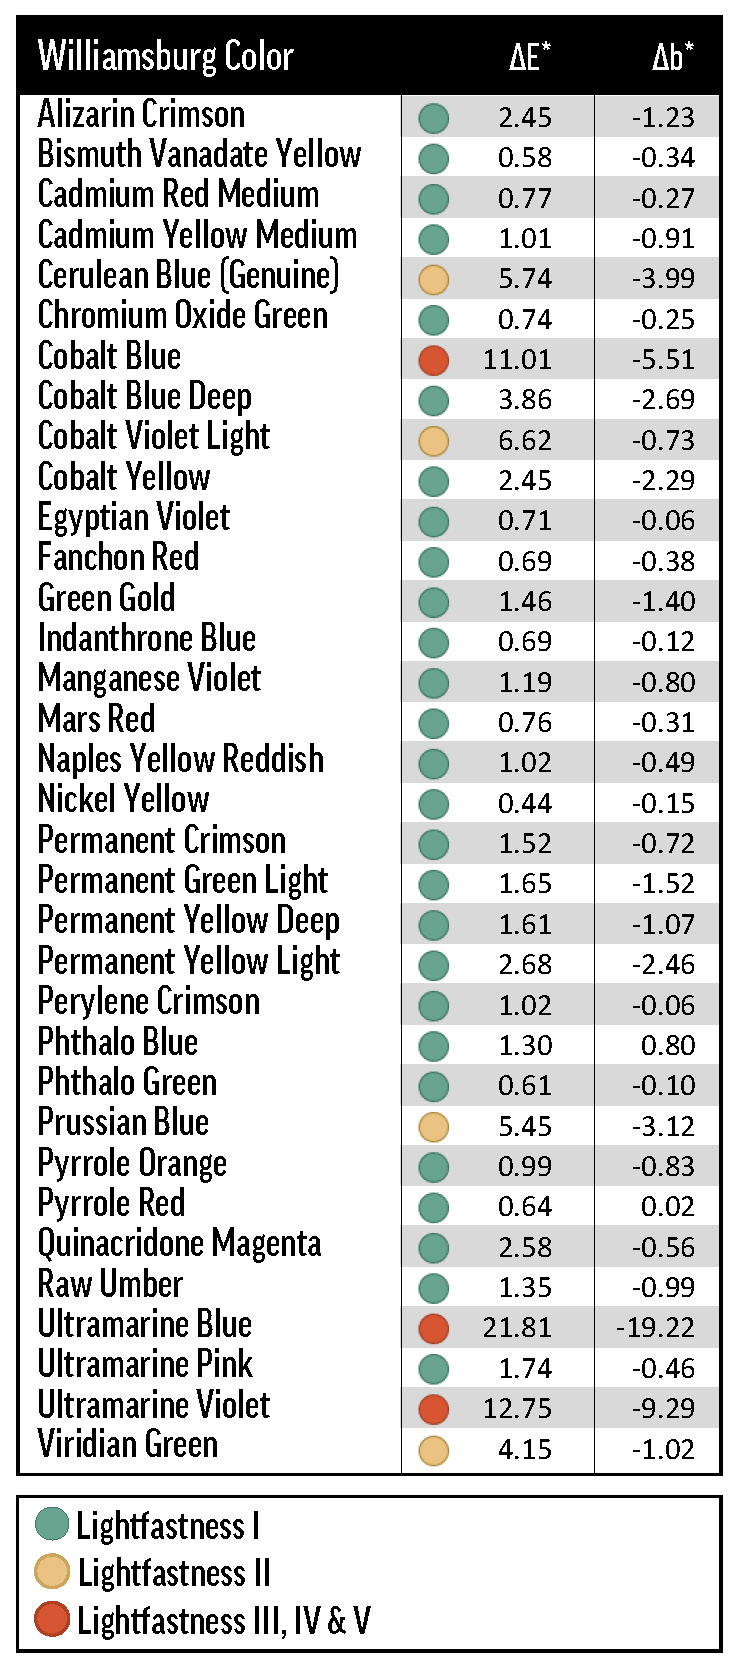
The masstones of Williamsburg colors were less affected by de-yellowing—their average Δb* was -2.4 while the whites’ averaged -4.0—but negative Δb* values were still a dominant part of each color’s ΔE* (Table 5, Table 6). Because the blue pigments themselves tended to become less blue (more yellow in CIEL*a*b* space) over exposure testing, their apparent color change included less de-yellowing. In fact, of all the masstones, only Phthalo Blue (Δb* = 0.80) shifted appreciably in the yellow direction. De-yellowing should (and these results suggest that it probably does) reduce net color change for bluer colors, and increase net color change for yellower colors.
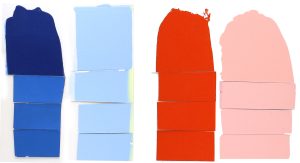
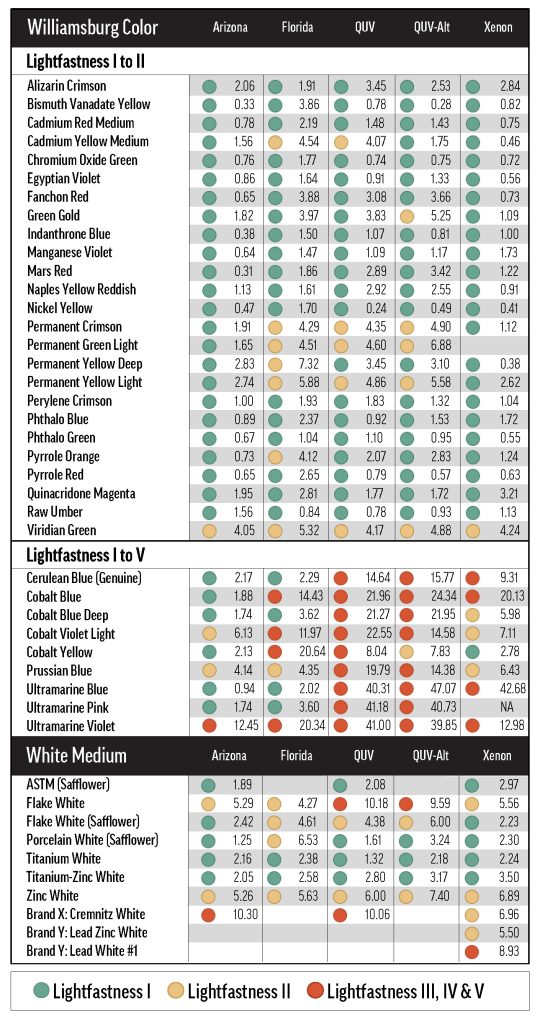
QUV and xenon arc exposure tended to be very damaging to the cobalt colors, which include Cobalt Blue (PB28), Blue Deep (PB28 variation), Violet Light (PV49), and Yellow (PY40); as well as Cerulean Blue Genuine (PB35), which contains cobalt and tin oxides (Table 6). When grouping by exposure method, the emerging pattern of fading isn’t quite uniform. For the most part, QUV was more damaging than xenon, which was more damaging than Arizona; Florida was exceptionally bad for Cobalt Yellow, a touch better for Cobalt Blue and Violet Light, and practically harmless for Cerulean Blue and Cobalt Blue Deep. Cobalt Yellow’s reactivity is well known1, and previous testing has made us aware that humidity can cause problems for Cobalt Yellow, but it was interesting that only some of the other cobalt colors had poor colorfastness in Florida. Similarly, we did not expect the cobalt-containing colors to perform so unevenly in xenon testing, with Cobalt Blue (due to chalking) and Cobalt Yellow ranking LF IV and LF I, respectively.
The especially reactive synthetic-inorganic Ultramarine (Blue—PB29, Pink—PV15, and Violet—PV15) and Prussian Blue (PB27) pigments also exhibited non-uniform failures in exposure testing (Table 6). Like the Cobalt colors, these pigments generally underwent the most fading in QUV, then xenon arc, then Arizona. Florida exposure caused unpredictable fading: Ultramarine Violet came back transformed by more than 20.0 CIE L*a*b* units, while Ultramarine Blue and Pink maintained their color. In QUV and xenon testing, the Ultramarines all faded about as badly as fluorescent pigments in acrylic paint, finishing to a cool, chalky gray. Because of these problems, it may be necessary to test samples with high proportions of a cobalt or ultramarine pigment only in Arizona; or at least to pair artificial light exposure testing with Arizona testing, giving more weight to the latter.
Results: Method
Color Concentration
As discussed in Results: Lightfastness, certain colors’ lightfastness was concentration-dependent, meaning that more saturated tints faded to a different extent than less saturated tints. Therefore, testing lightfastness at only one concentration may result in misleading conclusions for some colors.
For most of the relatively lightfast (LF I or II) colors, a 1-to-10 tint with Titanium White would have been sufficient to characterize lightfastness, but the use of multiple concentration levels was still needed to rule out significant concentration dependence. As an estimate of the color change variability due to concentration, we calculated the range of ΔE* values for the tints of each color across the tested concentration levels—this was the maximum ΔE* minus the minimum ΔE* for all concentration levels of each color in Titanium White. For example, the ΔE* range for Alizarin Crimson was calculated as 12.2, since the maximum ΔE* was 19.2 for the 9.1%wt tint and the minimum ΔE* was 6.0 for the 0.4%wt tint.
Figure 2a shows that half of the colors exhibited a ΔE* range of less than 2.0, and three-quarters spanned less than 4.0. The colors corresponding to the upper 25% of ΔE* ranges in Figure 2a were necessarily more fugitive, with results spanning at least lightfastness categories I and II. Some of these were the Ultramarine and Cobalt colors, which had inconsistent chalking and fading issues in xenon testing, escalating test variability without necessarily suggesting concentration-dependent fading.
Colors with a wider range of lightfastness results did not always have a clear relationship between concentration and fading. Practically, however, the ΔE* of each color’s 9.1% (1-to-10) tint decently approximated the maximum ΔE* across all concentrations of that color (Fig. 2), and could be used as a short-cut for testing lightfastness—especially in the context of a restricted quality control process. Testing at only one concentration will be misleading for certain colors (it might reduce Alizarin Crimson’s apparent lightfastness, and increase Green Gold’s) but this method could be a useful expedient for certain well-characterized pigments—at least as informative as the 40%-tint. Still, we would not recommend this simplification for the initial characterization of a material, or for testing pigments that have exhibited variable lightfastness; in these situations, multiple concentrations should be evaluated.
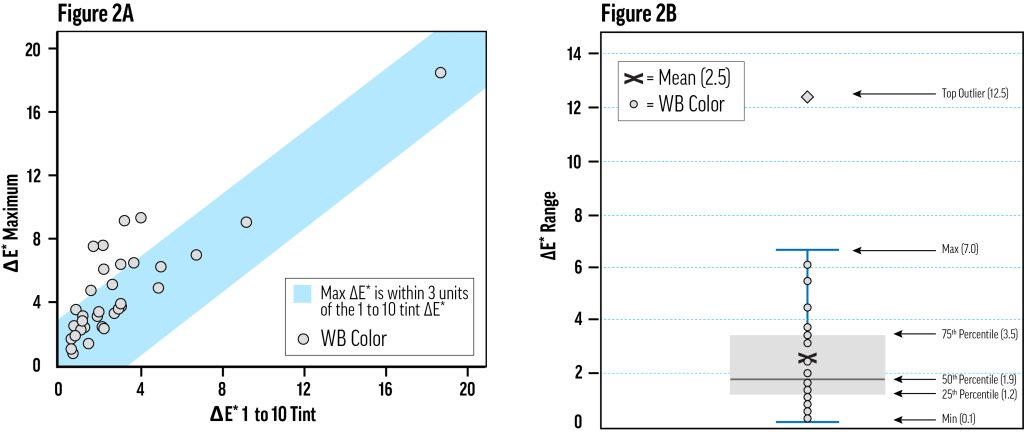
The amount of color change, ΔE*, varied with concentration for colors tinted with Williamsburg Titanium White. Figure 2A: To determine the amount of variation in color change due to changes in concentration, we computed the range of ΔE* for each color—the maximum ΔE* minus the minimum ΔE*. The distribution of these ranges is displayed in a box plot. Figure 2B: For several colors, the 1-to-10 tint (9.1%wt color) exhibited the most fading. Other colors performed well at that concentration, and poorly at some other concentration. The maximum color change has been plotted against the color change of the 1-to-10 tint, showing that for most colors, the latter captures the worst-case fading. The blue field encompasses the zone where the maximum ΔE* is within three units of the 1-to-10 ΔE*.
The above analysis of concentration dependence deals only with data averaged over Arizona and xenon testing. When looking at the exposure methods individually, we found that exposure method can sometimes have an important influence on concentration dependence. Some of the more striking examples are included in Table 7. A peculiar result is the reversed concentration dependence of Green Gold (PY129), a phenomenon most prominent in xenon and QUV testing. Permanent Yellow Light (PY3) had a negligible concentration dependence in Arizona testing but, similar to Green Gold, this relationship is much more concrete in xenon and QUV. Xenon, QUV, and Florida exposure methods generally emphasized concentration dependence: while this relationship might go unnoticed in Arizona testing, other exposure methods show more clearly that fading is related to color concentration.
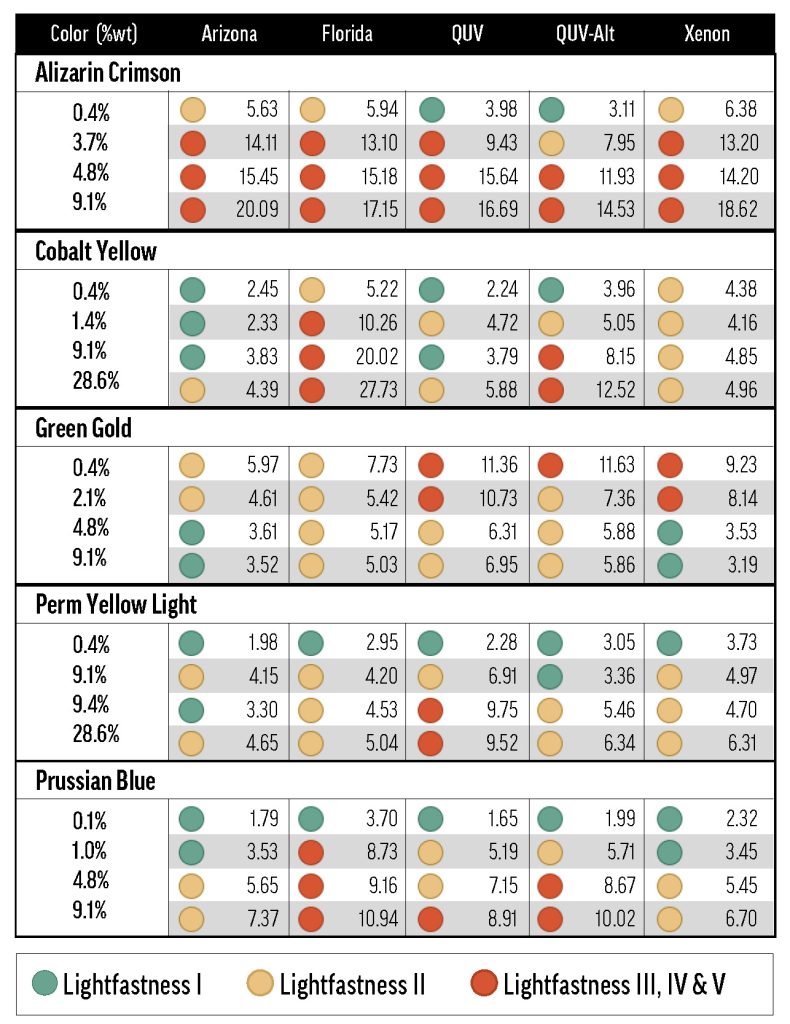
Historically, PR83 (Alizarin Crimson) has been used as a standard reference color for lightfastness testing3. As a result, lightfastness test methods generally elicit an expected degree of fading in reference pigments like PR83, but may not have the same effect on every pigment variety. In our testing, we did observe some important differences between Alizarin Crimson and other pigments. Unlike many of the other Williamsburg colors, Alizarin Crimson underwent the worst concentration-dependent fading in Arizona, and actually demonstrated a minor preference for the QUV chamber, where it exhibited the greatest lightfastness. While it’s desirable to find a one-size-fits-all approach to lightfastness testing, these results suggest that such an approach may be elusive.
Comparison of Exposure Types
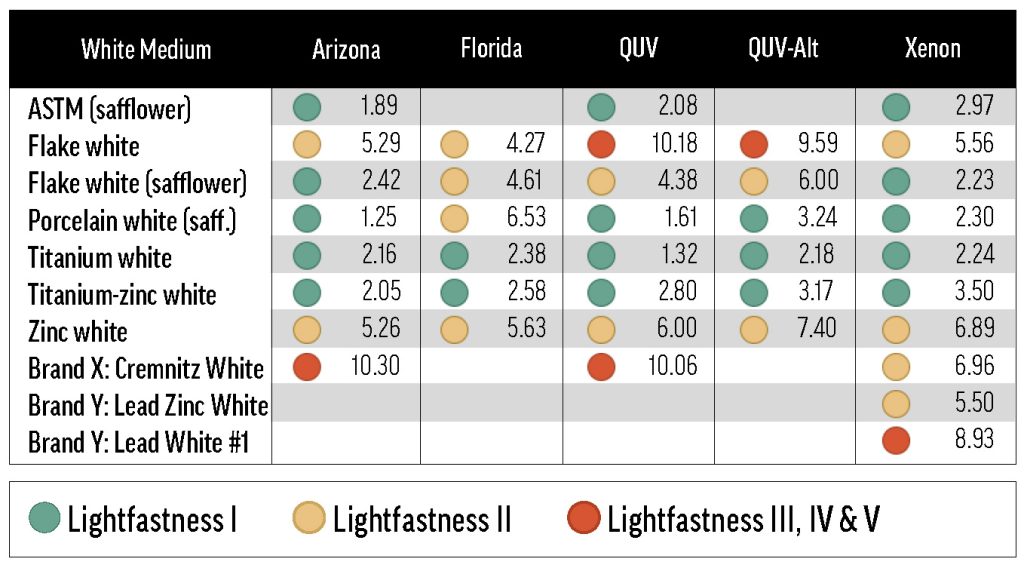
We found that the relationship between exposure type and ultimate color change was mostly determined by the white paint being used. Zinc and Flake White tints tended to be less lightfast in QUV and xenon, and the safflower whites tended to be less lightfast in Florida (Table 8). Titanium-Zinc and Titanium White Safflower tints were mostly similar to the ASTM tints, in that fading generally did not vary much across exposure types.
Unlike with the tints with other whites, the tints with Titanium White (across all concentrations), did show a few salient differences depending on exposure type. Most of the Titanium White tints were tested in Florida, and there were a couple of colors with notably divergent Arizona and Florida results. Besides Cobalt Yellow, Prussian Blue also exhibited somewhat increased color change in Florida testing (Table 7). A few colors were less stable in QUV and/or xenon than in outdoor testing, but the ΔE* differential was never large.
When taking all of the data (all tints and masstones) into account, the exposure types exhibited detectable differences in the direction and magnitude of the color change they induced. The ASTM lightfastness testing protocol is expected to alter the colorant only, bringing each sample’s apparent color closer to that of the tinting white. Any other color change could be indicative of a peculiar mode of color change, like graying or yellowing, or could be an artifact of the test method.
In the case of Florida testing, samples were softened by humidity and darkened by entrained dirt, processes which had the effect of neutralizing color and reducing total reflectance. Figure 3 shows how Florida testing stands apart from the other exposure methods. Importantly, it was only in select cases that Florida’s test conditions unequivocally accelerated pigment degradation in comparison with the other exposure methods (e.g., Cobalt Yellow or Prussian Blue, Table 7). Florida lightfastness testing might be useful for particular applications, but it may be necessary to account for a certain amount of baseline color change (darker, more neutral) for samples tested there.
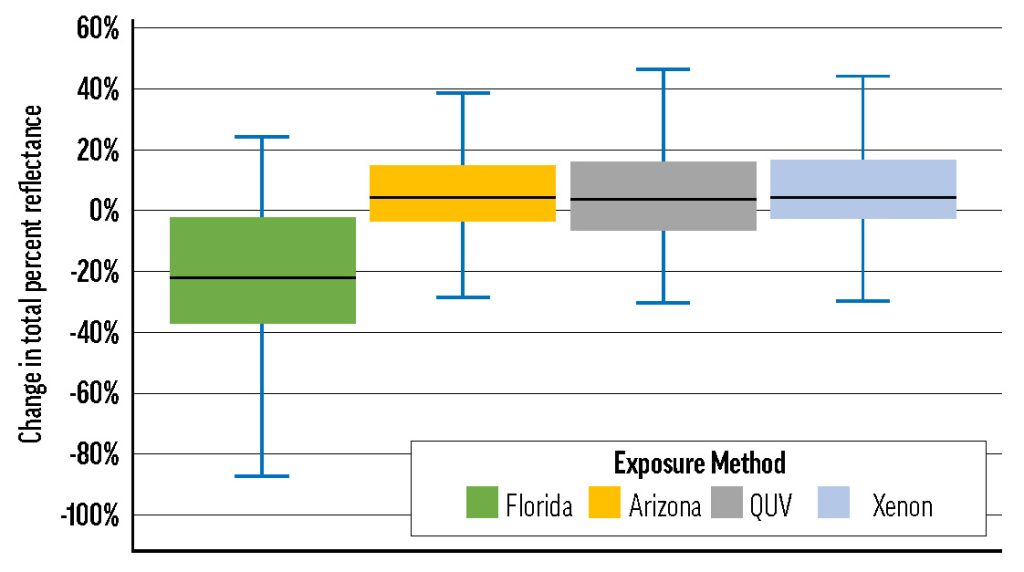
Box plots of the change in total percent reflectance of all samples as a result of exposure, broken out by exposure type. Here, total reflectance is considered to be the percentage of light reflected back from a sample within the chosen wavelength range (420-620nm). Typical fading entails an increase in total reflectance, as fading samples tend towards pure white, but 75% of samples tested in Florida decreased in total reflectance.
Similarly, the aggregate Δb* over each exposure type was a useful differentiator: samples undergoing QUV or xenon testing had an average Δb* of about -2.8, and Arizona samples averaged -2.5; in contrast, Florida samples averaged -0.3. The limited set of QUV samples undergoing periodic exposure averaged -0.6, while this same group de-yellowed significantly more in continuous QUV testing, averaging -1.42 Δb*. It’s interesting that alternating the light exposure in the QUV chamber had this effect, since the samples tested in Arizona did not. The discrepancy might be caused by the fluctuations in temperature and humidity that accompany the alternating schedule, though this result may also be significantly biased by the fact that many of the samples tested in the QUV chamber contained titanium dioxide.
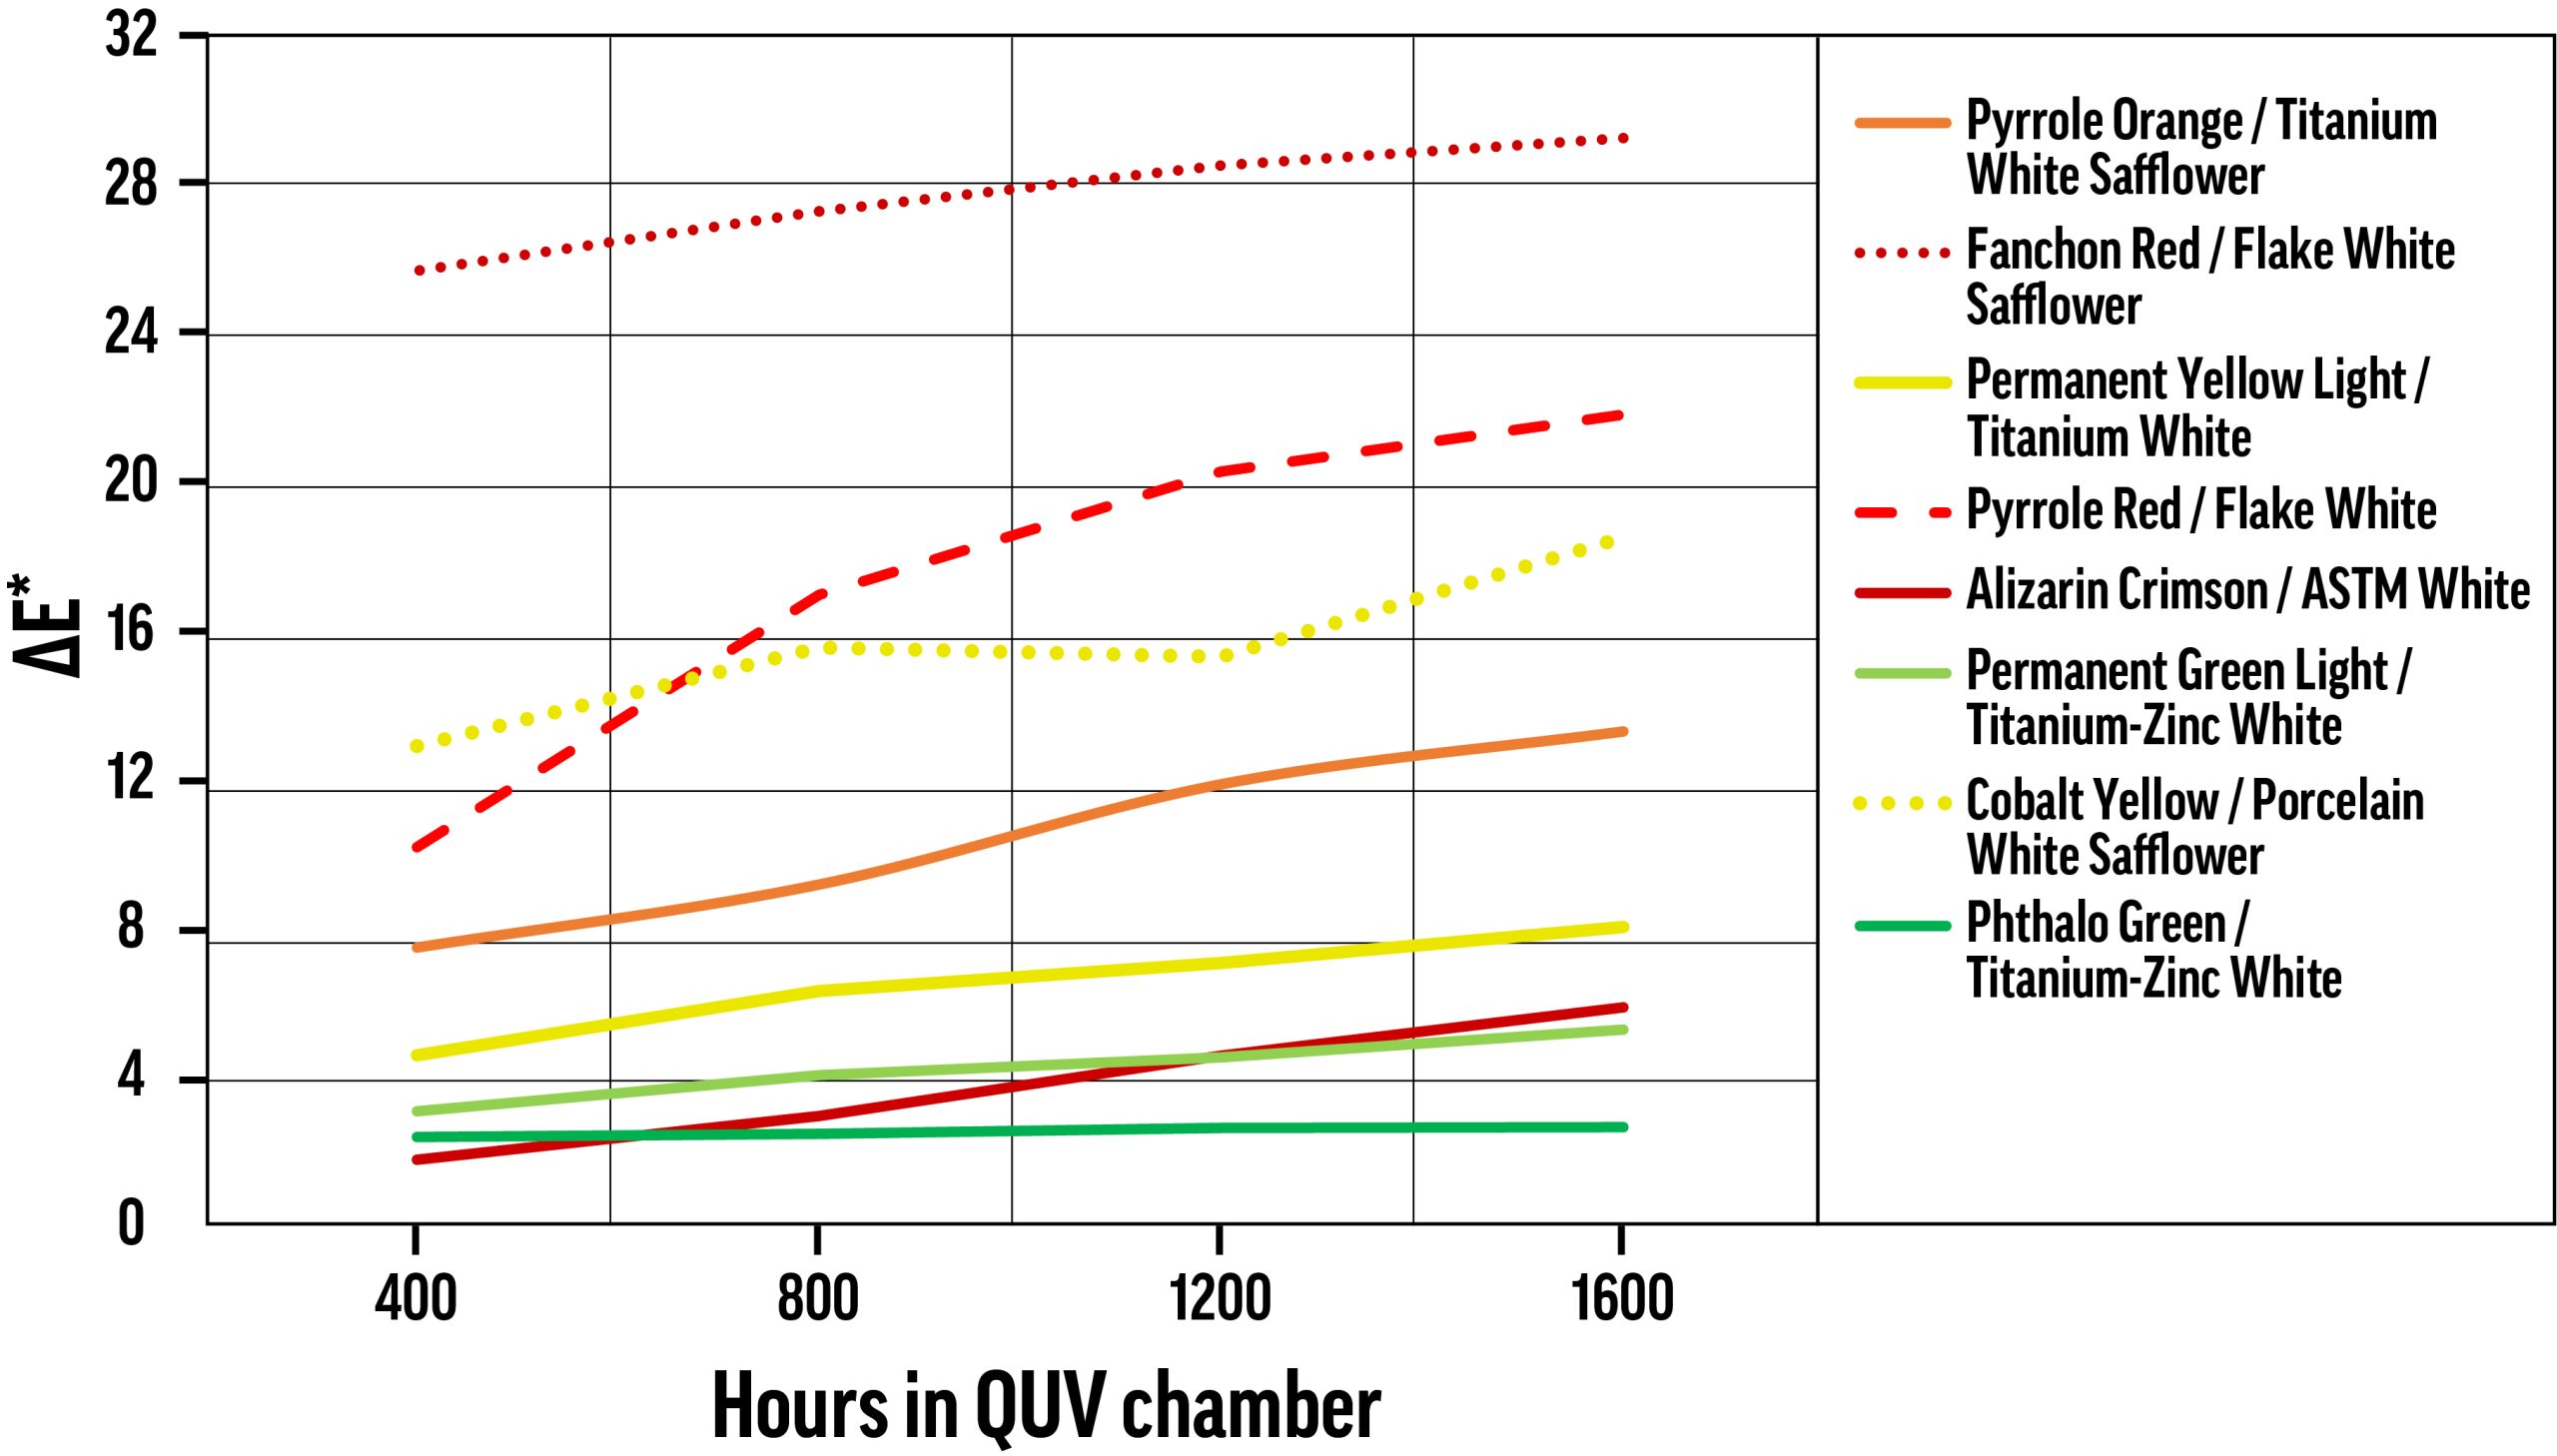
ΔE* values for samples tested using continuous exposure in the QUV chamber, with color change measured every 400 hours. The nearly flat Phthalo Green / Titanium-Zinc White curve is somewhat more typical than the other curves. Most colors underwent a large proportion of their ultimate color change before the first measurement, with some exceptions.
Exposure Time in QUV
Using the QUV chamber, sample color was measured every 400 hours, and color change was calculated for each increment. Averaging over all color/white combinations, about two-thirds of ΔE* occurs in the first 400 hours, and approximately 84% of Δb* occurs during that same period. Fugitive tints, like most of those displayed in Figure 3, show a more evenly distributed color change. As mentioned above, Flake White and Flake White Safflower performed very poorly in QUV testing, and almost every tint with these white mediums shows substantial increases in color change even after the first 400 hours.
Effect of Priming Aluminum Panels for QUV and Arizona Exposure Testing
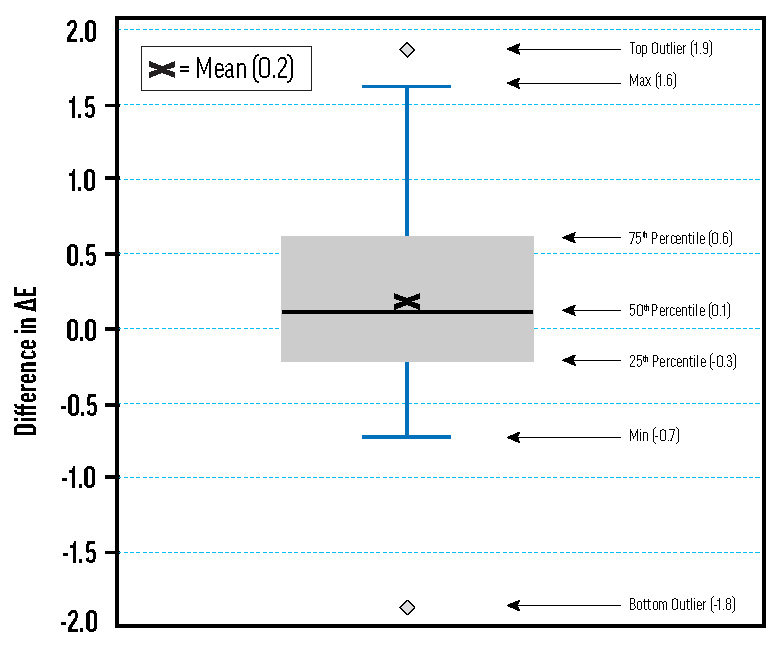
A box plot of differences in ΔE* for samples on primed and unprimed aluminum Q-Panels. Many of the tints made with the ASTM white medium were tested on both primed and unprimed aluminum panels using Arizona and QUV exposure methods. Difference in ΔE* is calculated as the ΔE* for the unprimed panel minus the ΔE* for the primed panel. The distribution is fairly normal, and the mean is close to zero.
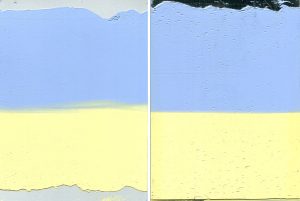
The ASTM lightfastness test stipulates that aluminum panel substrates should be sprayed or brushed with the oil-based primer described in D4302. After making the primer and spray-applying it to the aluminum panels, we applied tints made with the ASTM safflower-based white medium. Tints on primed and unprimed panels tested for lightfastness in Arizona and in our QUV chamber showed minimal differences approximating a normal distribution, as shown in Fig. 5. Using unprimed aluminum panels simplifies sample preparation and reduces the resources required for lightfastness testing.
Reactivity of Lead Whites
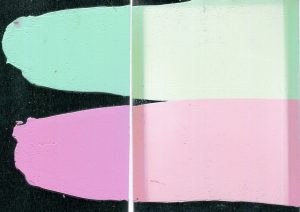
While preparing a 40%-tint of Fanchon Red (PR112) in Flake White Safflower, we discovered that the color can fade to white within days or hours of mixing and application. The lead was apparently catalyzing a reaction of PR112 that did not require elevated temperature or light exposure. These tints were very dilute—about 0.1% colorant—but the saturation was still realistic for ASTM testing and for use in painting, so this result was surprising. In testing with other manufacturers’ PR112 oil colors and lead whites, we have found that this phenomenon is not restricted to Williamsburg Artist Colors. While we have worked to ensure that current batches of Flake White do not degrade PR112 in this way, caution should still be used with Fanchon and Flake, and the combination should be avoided, especially in very light tints.
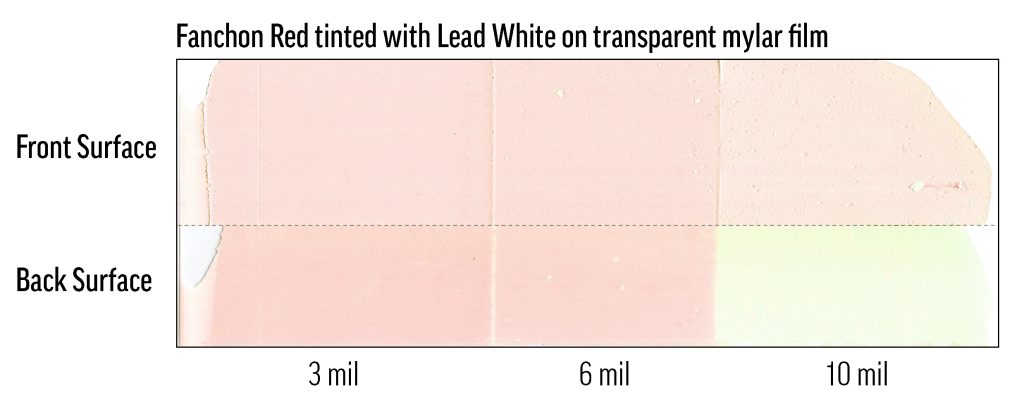
Fanchon Red was mixed with a competitor’s lead white at a concentration of 0.1%, then drawn-down in steps on mylar. The drawdown is in three film depths: 10mil (0.25mm), 6mil (0.15mm), 3mil (0.076mm). The substrate is a transparent mylar sheet. At the top of the image is the air-exposed, outer surface of the film; at the bottom is the back of the film as seen through the mylar substrate, which was kept in the dark except for occasional viewings. The outer surface of the film has faded significantly, but not completely (many test mixes faded completely to white), while the back of the film shows fading related to film-depth.
Because of the issue with Fanchon Red, we decided to do a comprehensive screening of select colors with Flake White. We prepared dilute, fixed-concentration tints of all of our organic and synthetic-inorganic Williamsburg colors with Flake White and tested their lightfastness in our xenon chamber. We found that Flake White tints, even those with organic colorants, were not all fugitive, and the LF-category assignments ranged from LF I to LF IV. Interestingly, some of the dilute mixes with Flake White grayed and yellowed excessively before they could be tested for lightfastness, but we did not see the dramatic fading that we found with PR112. Table 9 contains the color change results from this testing.
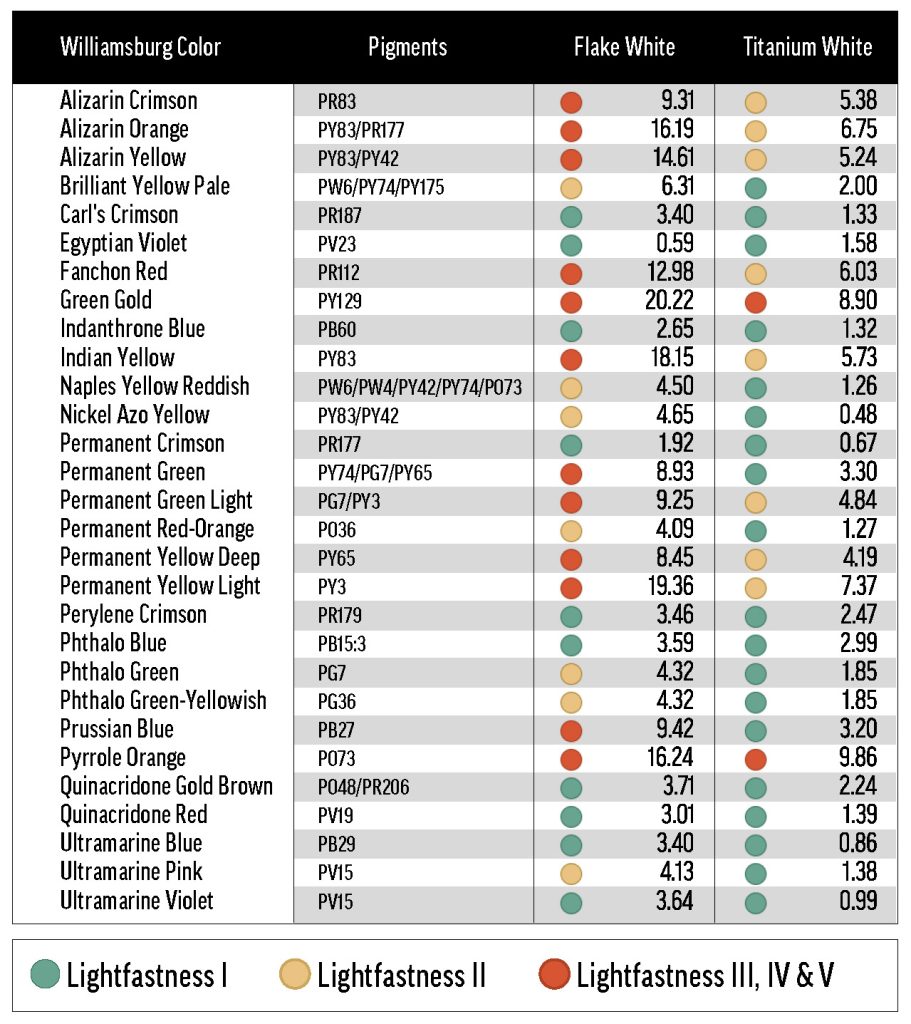
ΔE* values for xenon chamber testing on tints made with FW or TW at a colorant concentration of 0.1%. Titanium White has a stronger tint strength than Flake White, so the lead tints all had a slightly darker color when initially mixed. Some additional Williamsburg colors (beyond the set in Table 1), were used for this testing.
Suggestions for a Useful Method of Determining Oil Paint Lightfastness
The current ASTM specifications for lightfastness testing of oil paints and acrylic paints require that the reflectance spectrum of the UEC, in the range of 420 to 620nm, contains a minimum within 40±5% reflectance. Without prior knowledge of the tint strength of a particular colorant, around three mixes may be required to determine an appropriate weight ratio of color to white. With oils, the problem is compounded by the yellowing that occurs, to greater or lesser degree, as the paint dries, and by the variable dry times of different oil paints. Our strategy was to use a noncontact spectrophotometer to measure color the same day a mix was produced, allowing us to quickly iterate through trial mixes of varied concentration. This practice reduced the time required for sample preparation, and it decreased the number of samples that needed to be kept on hand as we waited for them to dry—it also made organizing all of our samples somewhat easier, which is a substantial benefit. These expedients, however much they reduced our use of labor and materials, did not compensate for the more than one thousand pre-mixes—which required hundreds of hours of mixing, instrument operation, and planning, as well as kilograms of oil paint—performed for this portion of our research.
Kubelka-Munk theory predicts that reflectance measurement error, relative to concentration, should be minimized when the reflectance is 41.4%4. As a result, reflectance should be measurable to the greatest accuracy, per unit of concentration, when a sample is made up to about 40% minimum reflectance. One problem with this approach is that accurate measurement of the unexposed control is only as important as accurate measurement of the exposed sample—which, if it isn’t very lightfast, will have a minimum reflectance greater than 45%. A more important problem is that it is presupposed that judging colors’ lightfastness based on apparent changes in concentration is ideal, when in fact we’re classifying pigments by perceivable color change, generally by using ΔE*. Since significant color changes can occur when the minimum reflectance is outside 40±5%, it may be important to test samples with higher or lower value.
In a practical sense, we know that artists will use oil paints at any dilution with white medium, and our appraisal of a material’s lightfastness should include that whole scope of use-cases. As we saw with the quintessential reference color Alizarin Crimson (PR83), total apparent color change can peak when the minimum reflectance is well outside 40±5%. Therefore, the 40% criterion may be leading us away from some troubling results. There are color-stability issues with mixes made with very low or very high colorant concentrations, and these need to be investigated. At the same time, colors without major lightfastness issues should perform well regardless of concentration or value, and testing these colors at multiple concentrations would bear this out. It would be beneficial to test colorants using at least three realistic concentrations, and a fourth—possibly near 40% minimum reflectance—could provide an even better understanding of a color’s lightfastness.
For typical quality assurance needs, color concentrations of 2.0%, 10.0%, and either 0.2% or 25.0% (depending on the color’s qualitative tint strength) should cover most situations. This simple ladder approach eschews tedious pre-mix steps with color measurements and reflectance calculations, and could be performed with the minimum of instrument time—making the protocol more accessible without significantly reducing accuracy. Still, colors with known lightfastness issues should be treated with special care, since they are more likely to give variable results. Using alternate or supplementary concentrations may help to give a clearer picture for certain paints, especially those that are exceptionally strong- or weak-tinting. Additionally, testing the masstone is important, since it is commonplace for artists to use paint right out of the tube. Some masstones failed in exposure testing, even when their tints performed well.
Beyond mixing ratios, there are several issues relating to sample preparation and exposure method that need to be considered. Arizona and xenon testing seem relatively reliable and useful for differentiating colorants, though certain pigments are very sensitive to xenon testing. It may be worthwhile to investigate xenon testing protocols with a longer duration and lower intensity, as certain colorants appear to be less lightfast under the current protocol. Periodic color measurements over the duration of an exposure period may be useful for characterizing the behavior of certain fugitive products and for determining an optimal duration for general testing. Outdoor testing in Florida is probably less helpful, but potentially interesting for particular applications. Choices of ground and substrate (as long as neither reduce sample integrity) seem to be minor issues.
Obviously, it is not safe to assume that lightfastness is completely dependent upon the color, as the choice of tinting white has been shown to significantly affect fading. Testing intra-brand combinations of colors and whites could be important for certain products, as it was for some Williamsburg Artist Oil Colors, and is recommended.
Conclusion
Although some of the lightfastness findings presented here are worrying, one positive takeaway is that most of the colorants tested could be ranked as either LF I or II with at least one white. Titanium White would be a safe choice for anyone concerned about lightfastness. While the specificity of the relationships between other whites and colors may increase the already cumbersome technical burden for oil painters who use these products, it’s fortunate that most of the pigments we tested are basically reliable.
This research, and the research of the other members of the ASTM Art Materials Subcommittee, is part of an effort to update oil paint lightfastness standardization. Lightfastness is not a function of one variable—pigment—but of a concert of factors including binding oil, white pigment, and pigment concentration. These factors need to be taken into consideration when deciding how to test lightfastness, and how to communicate this information to consumers.
Readers interested in matters of lightfastness and paint quality in artist materials are encouraged to join the ASTM D01.57 Committee on Paints and Related Coatings, Materials, and Applications.
Future Work
While the combination of titanium and zinc white pigments improves lightfastness and reduces yellowing, zinc is well known for causing embrittlement. All of the samples from this testing have been retained, so it will be possible to test the hardness and flexibility of tints made with Titanium-Zinc White or the ASTM white medium. Preliminary testing of Titanium-Zinc White samples has confirmed that, even at small loadings, zinc accelerates embrittlement, but safflower oil may counteract this effect.
To gain a better understanding of the effect of titanium-zinc blends on lightfastness, it would be interesting to compare tint ladders of Alizarin Crimson, or possibly some other colors with concentration-dependent or inconsistent lightfastness, in titanium-zinc whites where the proportion of zinc is varied.
More work with artificial light exposure, especially using a xenon arc chamber, would be beneficial for determining an optimal exposure procedure. Varying duration (and intensity, to compensate) of light exposure may give some interesting results. Some colors performed very poorly in xenon testing despite being relatively lightfast to solar radiation, so it may be the case that the current duration is overly abbreviated.
Works Cited
- Feller, R. L. Artists’ Pigments: A Handbook of Their History and Characteristics; National Gallery of Art ; New York ; Oxford, 1986.
- Johnston-Feller, R. M.; Bailie, C. W. Determination of the Tinting Strength Of Chromatic Pigments. Journal of Coatings Technology 1982, 54 (692), 43–56.
- Levison, H. W. Artists’ Pigments: Lightfastness Tests and Ratings; Colorlab, 1976.
- Frei, R. W.; Macneil, J. D. Diffuse Reflectance Spectroscopy in Environmental Problem-Solving; Chemical Rubber, 1973.
Appendix
A.1 Weight percentages for 40%-tints
A.2 Concentration and color change in acrylic medium
To avoid the issues of dry time and de-yellowing, we began a study of the relationship between concentration, minimum percent reflectance, and ΔE* with acrylic paint. Using GOLDEN Heavy Body Dioxazine Purple (PV23), which has a lightfastness rating of LF II, we made a ladder of tints in Heavy Body Titanium White. These tints were exposed to 510kJ/m2 in our xenon arc chamber. Table A.2 shows the concentration (percent weight of Dioxazine Purple) and ΔE* for each tint, alongside a computer rendering of each UEC and exposed sample. ΔE* peaks at 8.12, and varies with concentration.
Subscribe
Subscribe to the newsletter today!
No related Post


Outstanding work guys!! An awful lot to digest here and confusing in some ways (as anything to do with lightfastness is!).
Thank you so much!
Thanks! It was certainly a lot for us to digest as well! Let us know if you have any questions.
Wow! What amazing, groundbreaking work — it will change the way artists, educators, and conservators think about paint. (As an artist it is certainly shifting the way I think about paint). These are fascinating insights on the performance of Ultramarine, Pyrrole, and Green Gold.
Information on the performance of pigments in various whites and binding oils helps a lot to inform artistic decisions.
The paintings which we spend so much time making will now last longer thanks to your work.
Thank you for leading the way on lightfastness!
Thank you so much for the kind words!
I am only coming to this article now and just wanted to say how proud I am of the continuing work you have done on these issues – you have taken it to a level and breadth I could only have dreamt of. Congratulations on the testing and compiling of such amazing and groundbreaking work. Truly – Sarah Sands
Thanks so much Sarah! It really means a lot coming from you.
Thanks so much for the hard work! The team at Golden is the best! Could some of the pigments that performed less than excellent when mixed with flake white, such as Lightfastness II and in some cases worse (Green Gold), perform better if kept closer to the mid-tone to darker values? I am also a little confused as to why Indanthrone Blue flake tint performed at a lightfastness II on the first chart but on the flake white reactivity chart, Indanthrone Blue performed at a lightfastness I?
Thanks for the compliments and questions!
Yes, I think it is possible that darker-value tints with Flake White could be more lightfast than lighter-value tints. As part of our follow-up work, we will be testing some color/white combinations at multiple concentrations. We’ll also test these combinations using each of the exposure methods we used for the current work, since Flake White’s performance was highly dependent on exposure method.
I can’t give you a definitive answer about the disagreement of the Indanthrone Blue results, since there are a few possible explanations. The Flake White reactivity testing did not include all of the exposure methods and did not use the same samples or the same color:white ratios. In that section, all of the tints were made by using set ratios of color:white, and only tested using the xenon chamber. Any of these differences may have caused the discrepancy. Hopefully after some more testing we can provide a more definitive answer!
So, we have a conundrum. Basic lead carbonate white apparently strengthens paint films and yet simultaneously has problems with yellowing, greying (if the pigment is impure), and — especially — bleaching many pigments. The amount of yellowing can be reduced (although not eliminated) by eliminating filler such as blanc fixe and perhaps also in terms of accepting shorter shelf life for tubes in exchange for less stabilizer. I suppose it’s good news that the lead is unsuitable for so many pigments. It gives us more reason to avoid it, given its toxicity. This, though, means people need to invest more into using stable supports and storage/display environments.
Hi Stephen,
Unfortunately, I think this is one of many conundrums with oil paint! For our part, we try our best to understand these problems and help artists navigate them–but there isn’t always a clear path forward.
There are definitely reasons to move away from lead, toxicity not least among them. I would agree that more stable supports and less damaging storage will do a lot to preserve paintings that have any issues with film integrity. Putting away lead white will certainly require artists to find some other methods for solving the problems currently solved by lead.
Thanks for contributing to the discussion!
Fascinating if depressing findings for lead white lovers. Many thanks for all your hard work.
Could you please clarify which reasons, apart from toxicity, and now these lightfastness problems, might persuade an artist to move away from lead white?
Thanks for the comment, Jenny!
Aside from the lightfastness and toxicity problems posed by lead white, I think titanium white carries some benefits that could draw artists away from lead. Titanium whites are generally less reactive, often have a higher tint strength, and are usually less expensive than lead whites. That said, some artists who are very used to lead white may find that titanium really doesn’t work for them!
Let me know if you have any other questions.
Hi,
Is it possible to fix the footnote under the table near top of the article? It looks like a sentence was cut off: … . For the Williamsburg colors, a “GAC” lightfastness rating indicates that lightfastness testing was peThe….
I m assuming it explains the difference between GAC and an ASTM rating.
Thanks.
Thanks for catching that! It should be all set now.
When a pigment is not rated by ASTM for lightfastness in oil paint, the Golden Artist Colors lab will test it independently of the ASTM Artist Materials subcommittee. This way we can determine if there are any risks of lightfastness problems when using that pigment in the Williamsburg line. In reality, we actually test most of our products (across product lines) for lightfastness on a periodic basis, even if the ASTM rating has not changed. This helps us catch any unexpected problems, like the declining lightfastness we saw in our acrylic Hansa Yellow Light and Medium (see https://justpaint.org/hansa-update/).
Let me know if you have any other questions!
Wow, that Spectro 1 (SCE?)from Variable cost only $300, it’s really tempting…
I used to buy a very strange chinese(CHN Spec?) Colorimeter which is able to show spectral curve, while it’s method sucks, D/8 SCI, the result tend to differs from what i see, measure a black and it get gray…
Is there any article on those stuff while also readable by common painter?
Sure thing, Nourkias. If your primary interest is your perception of color, then you can try to keep things simple and affordable by sticking to colorimeters instead of spectrophotometers. Read about the differences between these devices here.
You might also be interested in our Just Paint articles on Color Nomenclature, Specific Subtleties of Color, the Deception of Perception in Printing, Lightfastness Basics, and Lightfastness Testing at Golden.